
Frequency Response Function (FRF)
A Frequency Response Function describes how a system responds to an input at different frequencies.
If x(t) is the measured input and y(t) is the measured response, the FRF expresses the frequency-dependent relationship between them.
Typical applications include:
•vibration and modal analysis;
•impact-hammer testing;
•structural resonance measurements;
•acoustic transfer measurements;
•comparing excitation and response signals;
•estimating gain and phase through a system.
In SIGVIEW, FRF calculations are available through Signal Calculator.
FRF magnitude and phase
An FRF is a complex-valued frequency-domain quantity and therefore contains both magnitude and phase information.
SIGVIEW provides two result types:
•FRF magnitude: Shows the frequency-dependent amplitude ratio between output and input.
•FRF phase: Shows the frequency-dependent phase difference between output and input.
For an input signal x and output signal y, SIGVIEW calculates FRF magnitude from the cross-spectral relationship between input and output and the autospectrum of the input.
The source-signal order is therefore important: select the excitation/input signal first and the response/output signal second.
Creating an FRF
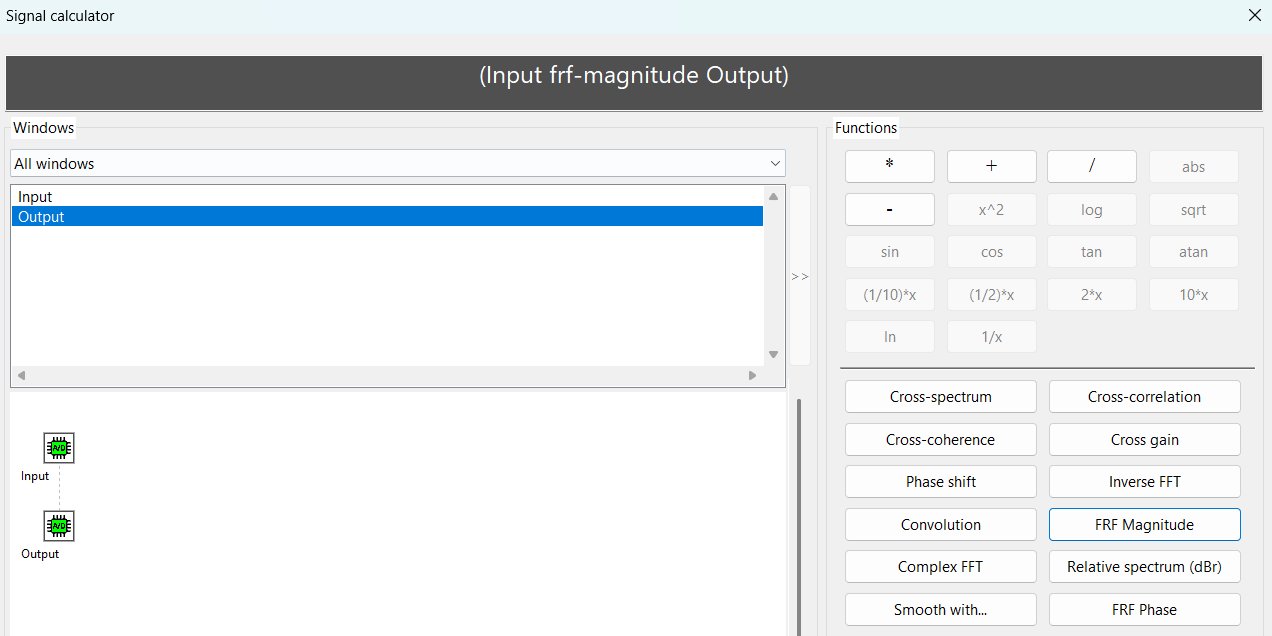
1. Make sure that both input and output signals are available in the workspace.
2. Open:
System control > Signal calculator
3. Add the input signal.
4. Select either:
FRF magnitude
or:
FRF phase
5. Add the output signal.
6. Click OK.
SIGVIEW creates a new FRF result window linked to both source signals. The result is recalculated automatically when either source signal changes.
Interpreting FRF magnitude
Peaks in FRF magnitude indicate frequencies at which the measured system produces a relatively strong response compared with the applied input.
In structural and vibration measurements, prominent FRF peaks often correspond to resonances or natural frequencies.
The absolute FRF units depend on the physical units of the input and output signals.
Examples:
•acceleration / force;
•velocity / force;
•displacement / force;
•voltage / voltage.
For this reason, FRF magnitude should be interpreted together with the sensor calibration and physical meaning of both channels.
Interpreting FRF phase
FRF phase shows the phase relationship between the measured output and input at each frequency.
Phase changes around resonances can provide additional information that is not visible from magnitude alone.
Phase values are meaningful only where the measured input/output relationship is sufficiently strong and stable. For noisy measurements, inspect coherence together with the FRF.
Using coherence with FRF
Coherence is a useful quality indicator for FRF measurements.
A coherence value close to 1 indicates that the output has a strong, consistent linear relationship with the input at that frequency.
Low coherence can indicate, for example:
•measurement noise;
•additional unmeasured excitation sources;
•nonlinear behaviour;
•insufficient signal level;
•time-varying behaviour;
•inadequate averaging.
For practical measurements, it is often useful to calculate FRF magnitude, FRF phase, and coherence from the same two channels.
Averaging
FRF measurements often benefit from spectral averaging, especially when the signals contain noise.
Averaging parameters can be configured in the FRF result window Properties dialog or through:
Signal tools > Spectral analysis defaults
For repeated impact or random-excitation measurements, averaging can reduce the influence of uncorrelated noise and produce a more stable estimate.
See Spectral Analysis Defaults.
Windowing
Windowing strongly affects FRF measurements and should be selected according to the measurement type.
SIGVIEW uses the Exponential window as the default window for FRF magnitude. This can be changed in the result window Properties dialog.
For impact testing, window choice depends on the recorded excitation and response signals. A window that is useful for a decaying response may not be appropriate for the impact pulse itself.
When possible, inspect the acquired time signals and verify that the selected window does not remove or distort important parts of the measurement.
See Spectral Analysis Defaults and Hammer Impact Test.
Impact-hammer measurements
A typical hammer-impact measurement uses two synchronized channels:
•Input: force or hammer signal
•Output: vibration response from an accelerometer or another sensor
FRF magnitude can then be used to identify resonant frequencies, while FRF phase and coherence provide additional information about the measured system and measurement quality.
For a complete workflow, see Hammer Impact Test.
See also