Time-FFT/Spectrogram
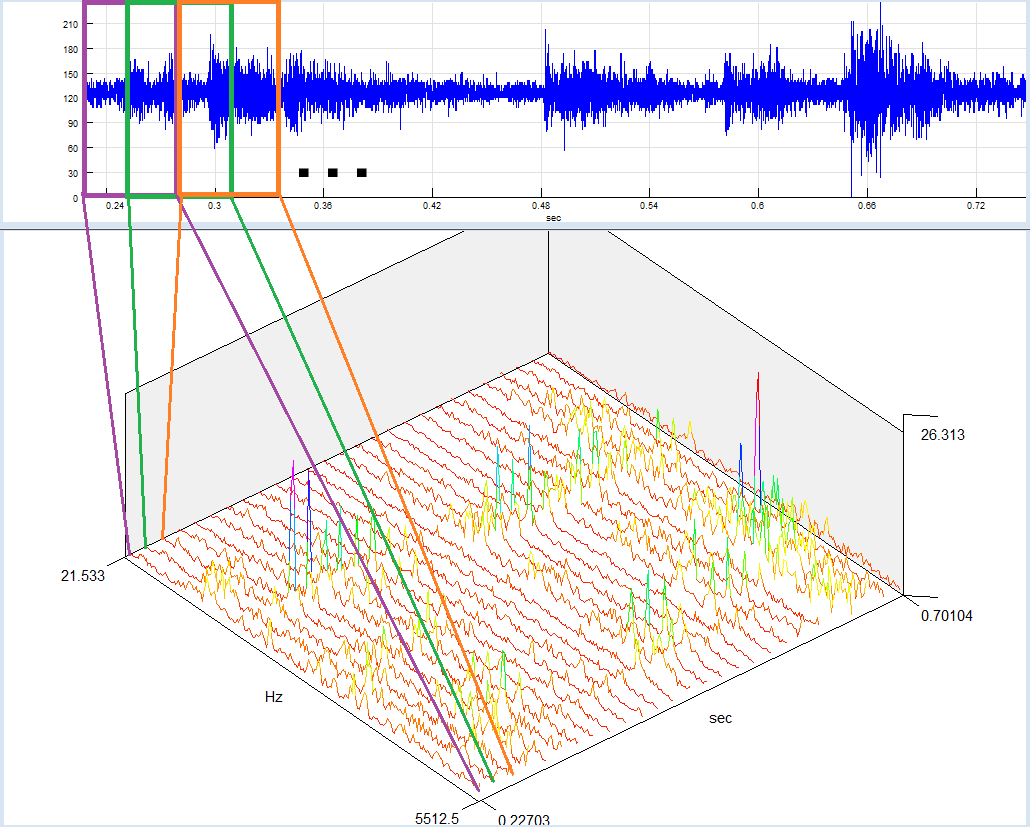
The Time-FFT function calculates change of signal’s frequency components through time. The signal is divided in smaller, equally spaced segments (possibly overlapped), an FFT for each segment is calculated, and all FFT sequences are used to build a 3D graphic. The same calculation method is used for Spectrogram view.
The FFT calculation parameters depend on your current Spectral analysis defaults. You can change the parameters for the calculated Time-FFT at any time by selecting the “Edit/Properties” option from the main menu or “Properties” from the context menu.
By selecting the “3D-Tools/Time-FFT” option from the main menu, you can set Time-FFT parameters, calculate it, and display as a 3D graphic.
Time FFT parameters
Time FFT Parameter Settings
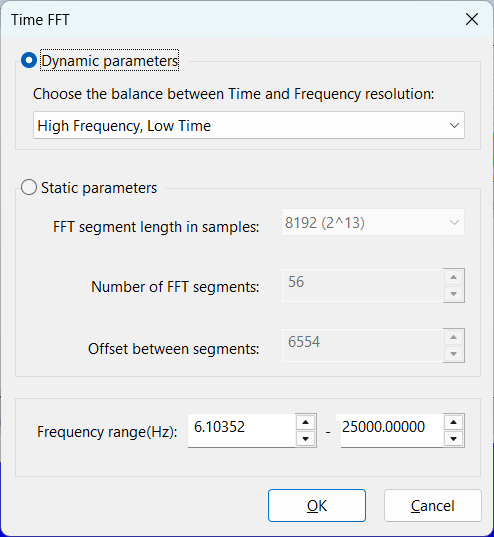
There are two modes for setting Time-FFT parameters in SIGVIEW, depending on whether you prefer automatic adjustment or full manual control:
Dynamic Parameters
In this mode, you select a general trade-off level between frequency resolution and time resolution using several predefined steps.
SIGVIEW then automatically determines the specific parameters — FFT segment length, number of segments, and segment offset — based on the length of the input signal.
This ensures that the Time-FFT window always adapts to any signal length, maintaining optimal balance between time and frequency precision without user intervention.
Static Parameters
If you prefer full manual control, you can choose the Static parameters mode.
Here, you define fixed values for the FFT segment length and the number of FFT segments. This allows fine-tuning of the analysis, but makes the Time-FFT window less flexible:
when the input signal length changes (for example, due to zooming in or out), these parameters will not adapt automatically.
You can manually set the following parameters:
•FFT segment length (samples): Defines the length of each signal segment used for FFT calculation.
•Number of FFT segments: Specifies how many signal segments are analyzed. This value can also be calculated from the segment length and offset.
•Offset between segments (samples): Distance between the start points of consecutive signal segments. It can be derived from the FFT segment length and number of segments.
Frequency Range Limitation
Optionally, you can restrict the frequency range used for Time-FFT calculation.
By default, the full theoretical FFT range — from SR/fft_length up to SR/2 (where SR is the sampling rate) — is applied.
Spectrogram
The spectrogram is a special form of Time-FFT analysis. It is calculated in the same way as a standard Time-FFT, but the resulting graphic is displayed from a top-down perspective. In this view, amplitude variations are represented using color coding - similar amplitude values are always shown in the same color.
To generate a spectrogram, select “3D tools > Spectrogram” from the main menu. This opens the same dialog used for Time-FFT analysis, but the output is displayed as a color-coded spectrogram instead of a 3D plot.
In the spectrogram display:
•The X-axis always represents time and runs from left to right.
•The Y-axis shows frequency. You can change the orientation of this axis through the Application settings dialog.
Editing Time-FFT/Spectrogram properties
Once you've created a Time-FFT or spectrogram window, you can modify its parameters such as FFT length, number of segments, and more by right-clicking the window and selecting “Time-FFT properties…” from the context menu.
For quicker adjustments, you can also use the keyboard and mouse together:
•Hold Ctrl and scroll the mouse wheel forward (up):
Increases time resolution and decreases frequency resolution by a factor of 2.
•Hold Ctrl and scroll the mouse wheel backward (down):
Decreases time resolution and increases frequency resolution by a factor of 2.
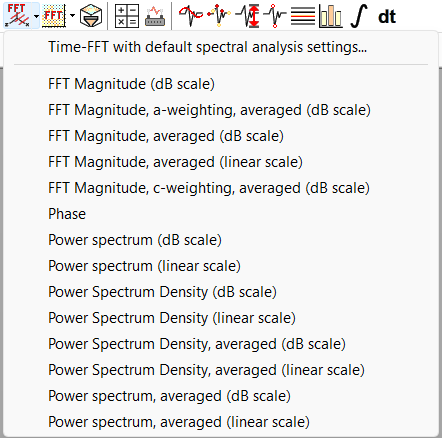
Predefined Time-FFT/Spectrogram variants
Various predefined combinations of FFT parameters are available directly from the toolbar or from the main menu: