Spectrogram View
Spectrogram View in SIGVIEW provides a top-down, two-dimensional representation of the 3D spectrum display, offering a clearer and more intuitive way to analyze time-frequency data. This view shows frequency on the vertical axis, time on the horizontal axis, and uses color intensity to represent amplitude - making it ideal for detailed inspection of signal changes over time.
To switch to Spectrogram View, go to “3D Tools > Spectrogram view” in the menu or click the corresponding button on the toolbar.
All standard 3D operations - such as cursor interaction, zooming, and color adjustments remain available in this view. Additionally:
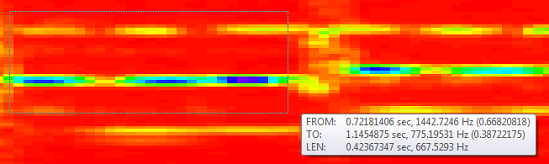
•Draw a rectangle with the mouse to quickly zoom into a specific region of the spectrogram.
•Use the mouse wheel for fast zooming in or out.
•Hold Ctrl while drawing a rectangle to measure its dimensions without zooming.
The time axis is always shown from left to right (X-axis). The direction of the frequency axis (Y-axis) can be changed by using the main menu option "3D Tools/Spectrogram frequency direction".
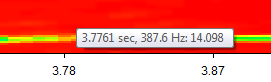
If you move your mouse cursor over spectrogram view, current X/Y values under the cursor will be displayed as a tooltip.