Palettes and Colors
Color palettes in SIGVIEW are an essential part of visualizing 3D data. They determine how different values of a function f(X,Y) are represented through color in a 3D plot or spectrogram.
Each 3D or spectrogram display uses one palette at a time - a predefined set of 1024 colors that maps data values to specific color intensities. This mapping helps you quickly identify patterns, peaks, and subtle variations in your data.
Selecting a Palette
You can choose a palette for any 3D or spectrogram display using one of the following methods:
•Right-click the 3D graphic and use the context menu
•Navigate to “3D Tools > Palette” in the main menu
•Click the corresponding toolbar button
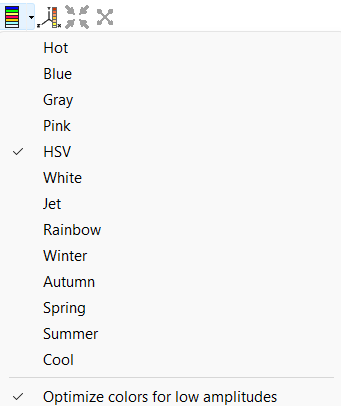
Available Palettes
SIGVIEW comes with a variety of built-in palettes, each suited for different types of data visualization:
oGray
oHSV
oBlue
oPink
oHot
oWhite
oJet
oRainbow
oWinter
oAutumn
oSpring
oSummer
oCool
Some palettes are better for linear scaling, while others enhance contrast in logarithmic data. The best way to find the right palette is simply to experiment with different options on your data.
Custom Palettes
Palettes are defined in simple *.pal files located in the SIGVIEW installation directory. Each file (e.g., hot.pal, blue.pal) contains 1024 lines, with each line specifying RGB color values that collectively form the 1024-color gradient.
You can change the palettes by editing these files, as long as you maintain the same structure and number of entries. This allows for flexible, personalized visual styles tailored to your analysis needs.
Enhancing Low-Amplitude Visibility
The "Color optimization for low amplitudes" option, available from the palette menu, provides an additional enhancement for spectrum-based visualizations:
•Enabled: Uses a non-linear color scale, concentrating more color variation in the lower amplitude range. This improves visibility of fine details that might otherwise be missed.
•Disabled: Uses a linear color scale, distributing color evenly across the entire amplitude range.
Inverting colors
When a 3D graphic is displayed in Mesh mode, you can invert its colors by selecting the “Invert Colors” option from either the context menu or the main menu. This adjustment typically assigns lighter colors to lower values, making the graphic easier to print and more visually accessible in grayscale or on paper.