
Application Settings Dialog
To change general application settings, applicable to all windows, you can use the Application settings dialog available from the menu option "File/Application settings dialog…":
General
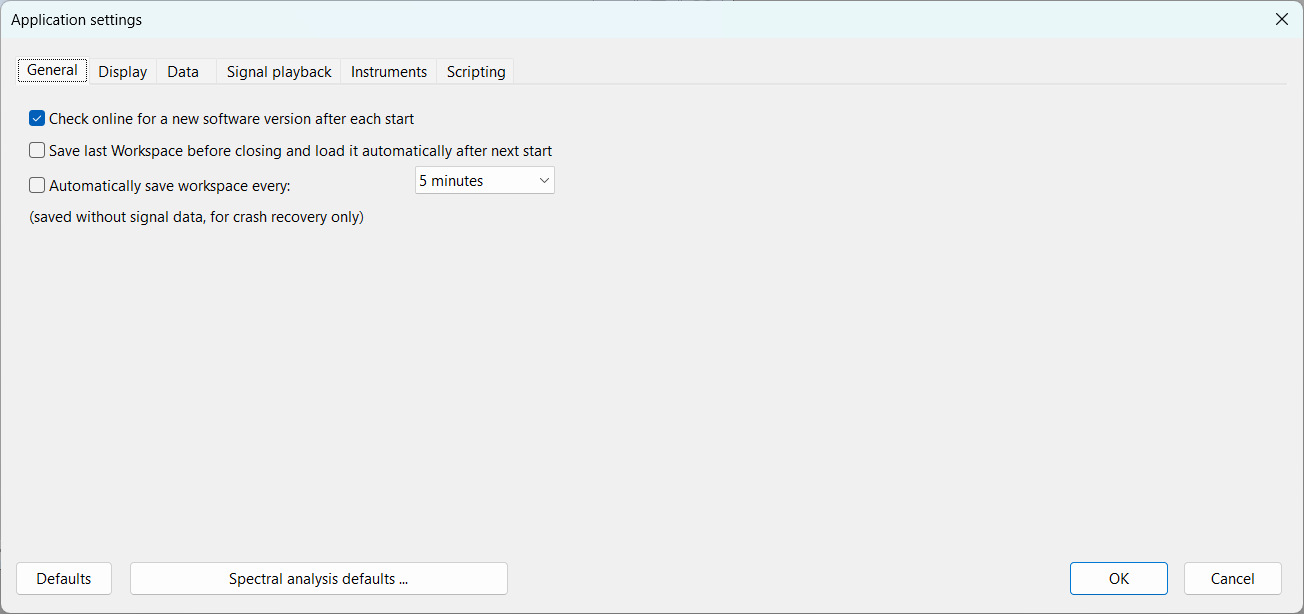
Check online for a new software version after each start: If this option is selected, SIGVIEW will search online for a new version each time it is started. You can turn the option off if it is slowing down the start-up process or you are not interested in new versions.
Save last Workspace before closing and load it automatically after next start: If this option is selected, the last Workspace before closing SIGVIEW will be automatically saved and reloaded next time you start SIGVIEW. As explained in Loading and Saving Workspaces, saved workspace will not contain actual signal or analysis data, but only the description of involved windows, their settings and relations. Therefore, it is possible that not all data will be restored after starting SIGVIEW again. The last workspace is saved in the file named "LastWorkspace.sws" in SIGVIEW Application Data directory.
Automatically save workspace every... : When enabled, SIGVIEW periodically saves your current workspace layout in the background, at the interval you choose (1, 2, 5, or 10 minutes). This autosave does not include signal data, so it stays fast and won't interrupt your work even with large signals open. It exists purely as a safety net: if SIGVIEW closes unexpectedly — after a crash or power loss, for example — you'll be offered the chance to recover the autosaved workspace the next time you start the application. The autosave file is deleted automatically on a normal exit, so it only ever comes into play when something actually went wrong.
Display
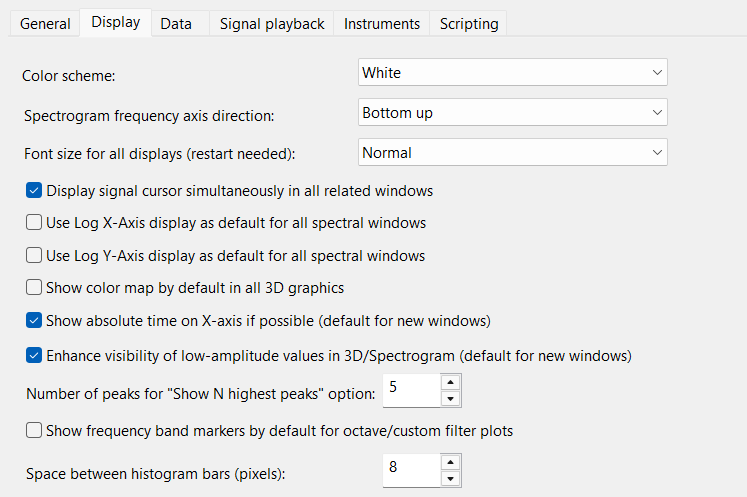
Color scheme: Choose color scheme for displaying all windows. White and Black schemes are currently available.
Spectrogram frequency axis direction: Choose the direction of the frequency axis (Y-axis) in spectrogram windows.
Font size for all displays: You can the general font size factor for all windows. This affects, for example axis labels, instrument values, status bar etc. You will have to restart SIGVIEW in order to apply new font settings.
Display signal cursor simultaneously in all related windows: If you turn this option on, a Signal cursor (including Audio playback cursor) will be displayed in all other signals related to the active window (its children, parents, synchronized windows) on the same position, if they use the same units and value range on their X-axes.
Use Log X/Y-Axis display as default for all spectral windows: By using these two options, you can determine if Log X/Y axis will be used for all new spectrum windows. Axis properties can, of course, be changed later for each window separately by using its context menu.
Show color map by default in all 3D graphics: Turn this option on if you want to see a color map on all new 3D/Spectrogram windows. You can also turn color map displaying on or off for each window by using its context menu. This option can be changed later for each window separately by using its context menu.
Show absolute time on X-axis if possible (default for new windows): When enabled, the X-axis in new signal windows will display absolute time (e.g., 22:15:11.345) instead of relative time (time since the beginning of the signal). This makes it easier to correlate data with real-world time events. You can still toggle this setting later for any individual window through its context menu.
Enhance visibility of low-amplitude values in 3D/Spectrogram (default for new windows): This setting affects how colors are mapped to amplitude values in new 3D or spectrogram displays. ON: Uses a non-linear color scale, assigning more color detail to lower amplitude ranges. This improves the visibility of subtle details in spectrum-based graphics. OFF: Uses a linear color scale, where color is distributed evenly across the entire amplitude range. This setting can also be changed later for each individual window using the context menu.
Number of peaks for "Show N highest peaks" option: This setting specifies how many peaks will be calculated and displayed when using "Show N highest peaks" context menu option on signal and 3D/spectrogram windows.
Show frequency band markers by default for octave/custom filter plots: When enabled, newly created octave and custom filter plots automatically display markers showing each frequency band's boundaries, so you can read off band values without hovering over the plot. This only sets the default for windows created from now on — it doesn't affect plots that are already open, and the markers can still be toggled on or off for any individual window afterward. It's off by default to keep these plots visually uncluttered, especially when many narrow bands are shown.
Space between histogram bars (pixels): Sets the width, in pixels, of the visible gap between neighboring bars in histogram-style plots (such as octave and distribution displays). Lower it for narrower gaps or wider-looking bars, or set it to 0 to remove the gap entirely so bars touch; very narrow bars will still keep a minimum 1-pixel width regardless of this setting.
Data
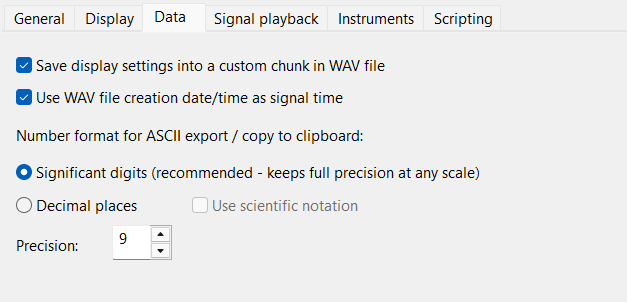
Save display settings into a custom chunk in WAV file: Use this setting to specify if SIGVIEW should store its custom parameter into a custom chunk in a standard WAV file. Should be turned off only if you have an older program which has problems opening WAV files saved from SIGVIEW. See File Formats for details.
Use WAV file creation date/time as signal time: This option determines if SIGVIEW will use WAV file creation time as signal time (only for WAV files which do not contain SIGVIEW custom data chunk)
Number format for ASCII export / copy to clipboard: Controls how numbers are formatted when a signal is exported to an ASCII/text file or copied to the clipboard. Significant digits (the default, recommended) prints each value with the chosen number of meaningful digits and automatically switches between fixed and scientific notation depending on the value's magnitude — this matches SIGVIEW's traditional export precision at any scale. Decimal places instead prints a fixed number of digits after the decimal point, with an optional "Use scientific notation" checkbox to force exponential form (e.g. 1.234e+03) rather than plain decimals. The Precision field sets how many digits are used — significant digits in the first mode, decimal places in the second.
Signal playback
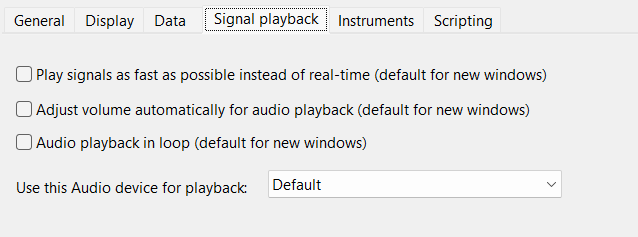
The following options determine the default values for any new created window. Each of the options can also be changed after the corresponding window is created. For the description of the functionality for these options, please see this chapter.
Play signals as fast as possible instead of simulating real-time speed (default for new windows)
Adjust volume automatically for audio playback (default for new windows)
Audio playback in loop (default for new windows)
Use this Audio device for playback: You can select the audio device to be used for audio playback. The "Default" setting will use the default audio output device in your operating system.
Instruments
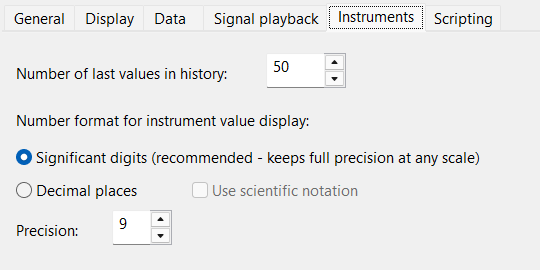
Number of last values in the history: Will be used for the display of last instruments values. Setting this value to 0 will turn the function off.
Number format for instrument value display: Controls how numbers are formatted wherever an instrument's live value is shown — inside the instrument window itself, in the status bar readout, and when an instrument's value is copied to the clipboard. Significant digits (the default, recommended) prints the chosen number of meaningful digits and automatically switches between fixed and scientific notation depending on magnitude, matching SIGVIEW's traditional display precision. Decimal places instead prints a fixed number of digits after the decimal point, with an optional "Use scientific notation" checkbox to force exponential form instead of plain decimals. As on the Data tab, the Precision field sets how many digits are used, depending on which mode is selected.
Scripting

Script editor: Allows you to define a custom editor to be used when editing Julia Scripts.
Spectral analysis defaults
"Spectral analysis defaults "button in the bottom of the dialog opens the same "Spectral analysis defaults" dialog available from Signal tools > Spectral analysis defaults ..., letting you review or change the default FFT/spectrum settings (window function, overlap, frequency resolution, and so on) used whenever a new spectral analysis window is created. It's offered here as a shortcut because these defaults are closely related to the Display tab's spectral options (like the log-axis settings), even though they're extensive enough to warrant their own dialog rather than living on a tab. Note that changes made there are committed as soon as you click OK in that dialog — independently of whether you click OK or Cancel in the main Application Settings dialog afterward.