Instruments statistics and values history
Instrument statistics
Each instrument includes statistics functions which automatically track its maximal, minimal, and average values.
To see one of these automatically calculated statistical values, you can use the instrument's context menu:
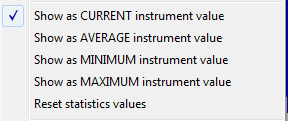
As a default setting, each instrument will show its current value, i.e. the "Show as CURRENT instrument value" option will be selected.
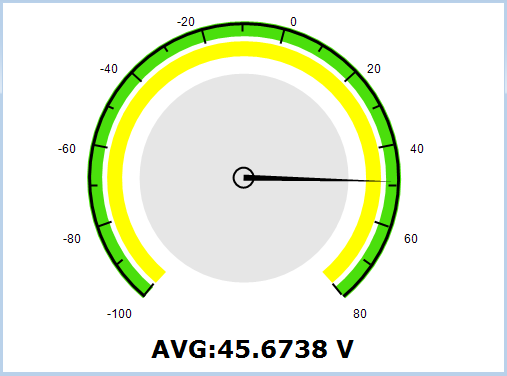
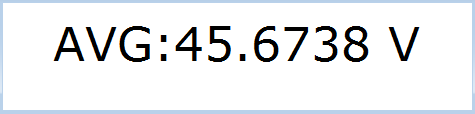
After choosing some of statistical values (AVERAGE, MINIMUM, MAXIMUM), the instrument will switch to displaying the chosen statistics value. That will be indicated by an "AVG", "MIN", or "MAX" prefix to the instrument value.
By selecting the "Reset statistical values & auto-range" option from the context menu, you will reset all statistical values to the current value of the instrument. If "Automatic range" is turned on, it will be reset as well.
After switching instrument display to some of statistical values, it will affect all windows attached to the instrument window as well, for example, the instrument value log.
Values history
Each instrument also displays a short history of its last values to help recognizing some trends or patterns.
The number of last values which are displayed can be set by using Application Settings Dialog. By setting this number of values to 0, the whole function will be turned off.
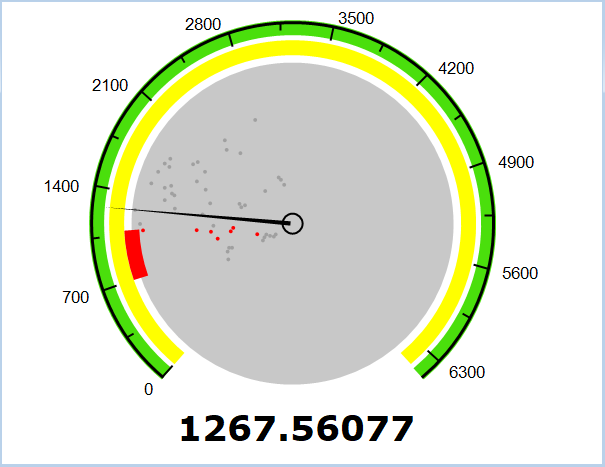
In analog-style instrument, these values are displayed as points in the grey circle inside the instrument. The newest values are displayed on the outside border of the circle, and the oldest values near the center of the circle. As new values are calculated, old points will drift from the outside perimeter towards the center. The angle position of the point corresponds to the current instrument scale. The following examples shows the instrument calculating a peak frequency in a sine signal with increasing frequency (sweep signal). You can see how the calculated frequency increases, i.e. the older points are in the lower scale range, and the newer points are moving into the higher scale range.

If you use "Critical value range" instrument option, the points falling in the alarm range will be displayed with red color.
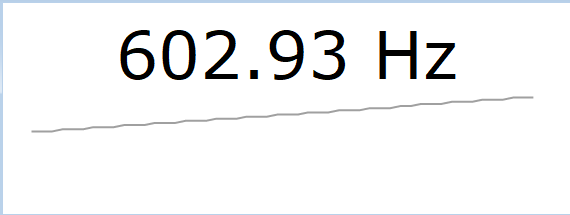
The same instrument, by using a numeric-only display type, will show a simple curve containing last values. In this example, you can also recognize that the value has been rising in the near past:
If you need more persistent tracking of the last values of an instrument, you can use Instrument values over time function.