Types of 3D Graphics
3D graphics in SIGVIEW are used to visualize functions defined by f(x, y), where x and y represent two varying domains - such as time, frequency, or other signal-related parameters.
SIGVIEW supports two main types of 3D graphics:
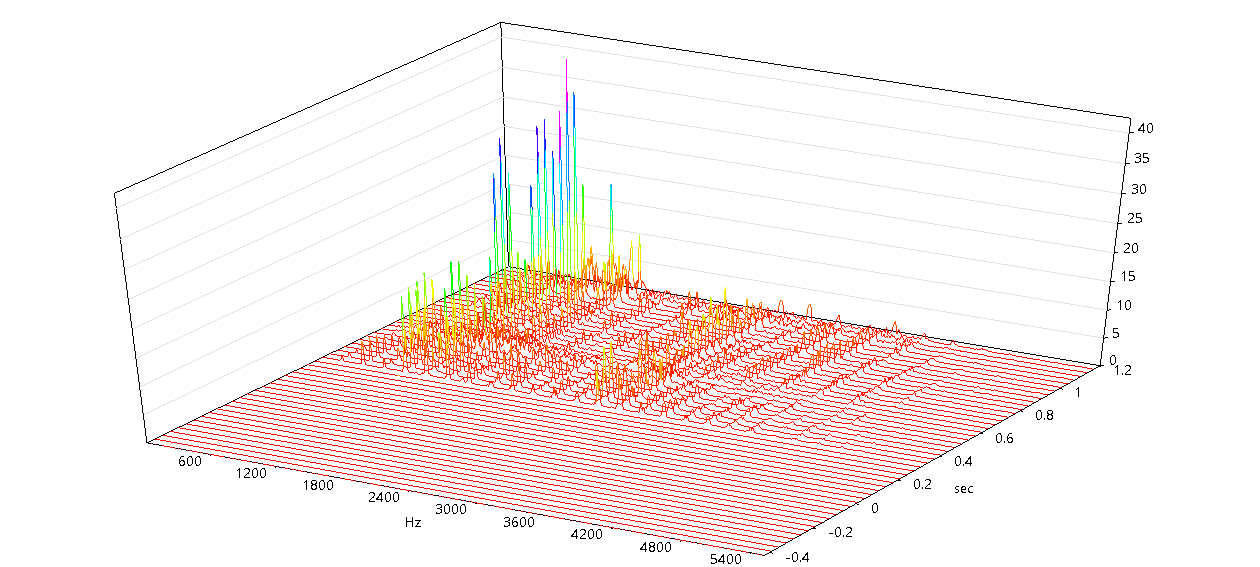
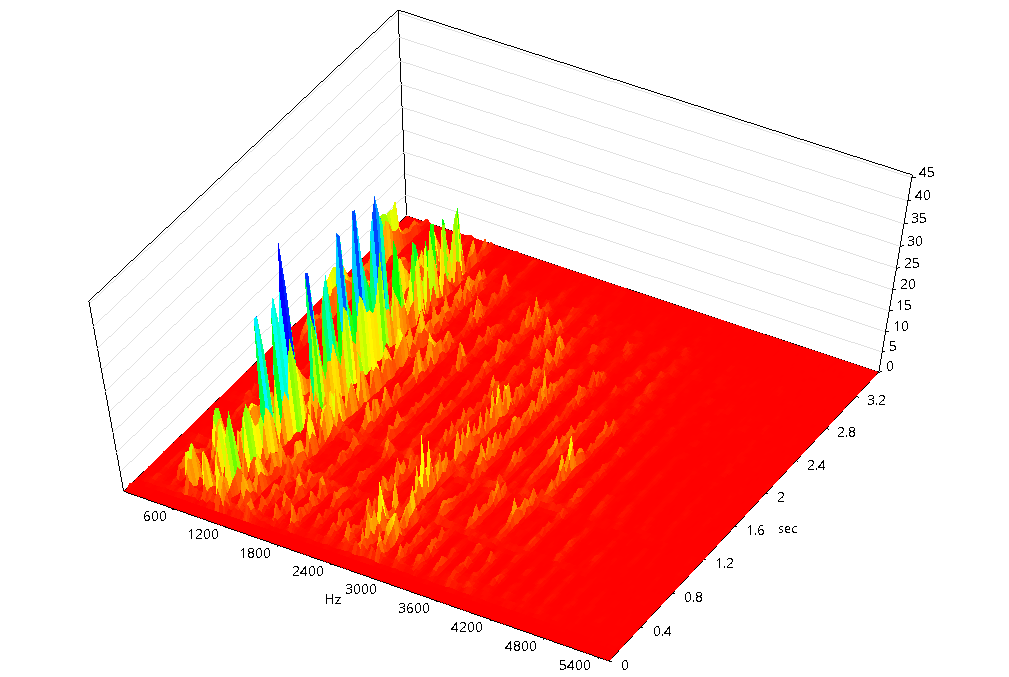
This type of 3D graphic shows how the frequency content of a signal changes over time.
•X-axis: Time (in seconds)
•Y-axis: Frequency (in Hz)
•f(X, Y): Intensity or amplitude of a frequency component at a given time
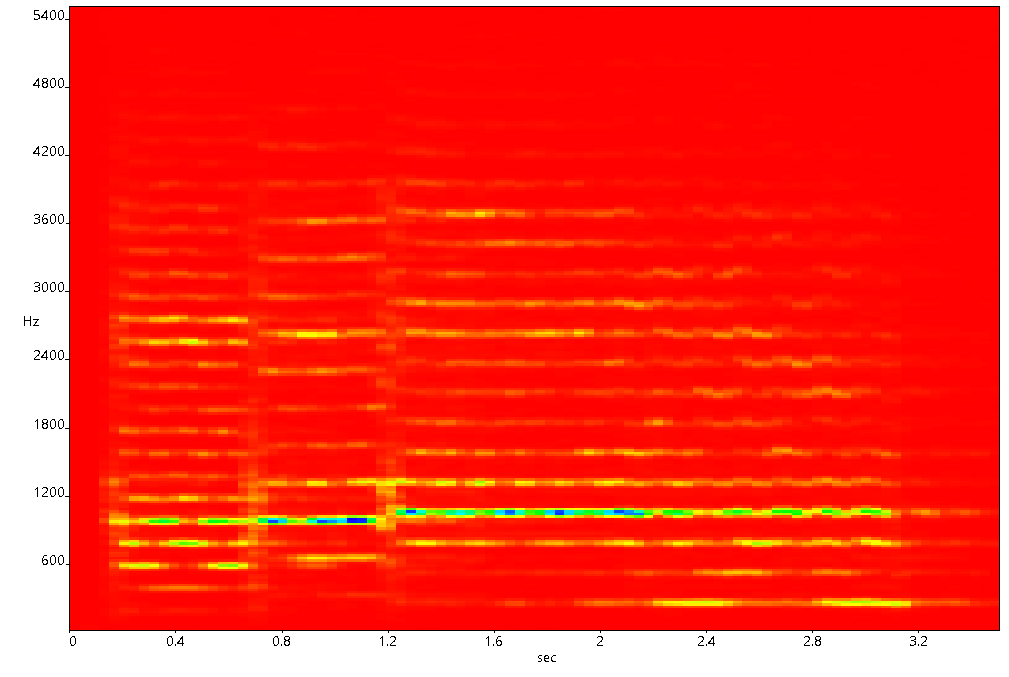
This view is ideal for analyzing time-frequency behavior in signals, such as detecting transient events or identifying dominant frequencies over time. A variant of Time-FFT is the Spectrogram View (Top-Down View). It is top-down projection of the Time FFT 3D graphic. Instead of showing depth, it uses color to represent amplitude values
Tracking Changes as 3D Graphics
This view is used to visualize how any array of values (spectrum, octave plot, autocorrelation etc.) evolves across significant changes or logged events.
•X-axis: Number of logged changes (referred to as “changes”)
•Y-axis: The original X-axis of the tracked array of values (e.g., time, frequency)
•f(X, Y): The signal value corresponding to each change over the tracked dimension
This type is useful for monitoring long-term trends or irregular events in a signal that are not uniformly spaced in time. See Tracking Signal Changes in a 3D Graphics or in a Spectrogram View for more details.