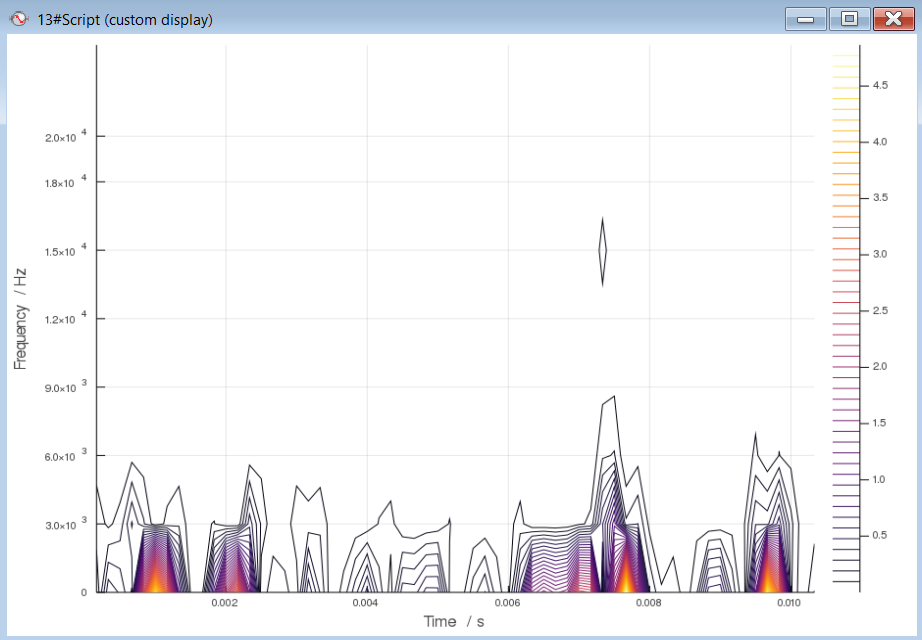
Spectrogram contour plot
This Julia-based plotting custom tool provides similar information as built-in Spectrogram function, but using a slightly different graphical representation.
Plot settings
By choosing Edit script... option from a context menu on polar plot display, you can change some plot settings directly in the Julia source code. As soon as you change some parameter and save the script, it will be changed and updated:
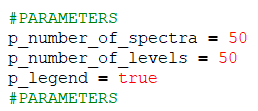
The available parameters are number of spectra, number of amplitude levels and a legend display.