Scatter and Orbit plots
Scatter and Orbit plot are Julia-based custom tools which provide various plotting capabilities to display the relations between thew values of multiple signals. Since these plots use multiple input signals, you would typically use them from Control Window.
These plots are generated by using Julia plotting functions and are embedded inside SIGVIEW windows. Therefore, they do not provide any interactive functions like cursors or context menus.
Scatter plot 2D
Scatter plot takes at least two signal as input and shows their values on an X/Y plane, using values from the first selected signal as X values and the values from the second selected signal as Y values. Both signals must have the same length.
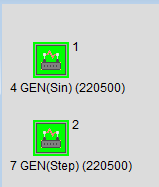
The order of signals is determined by the order of selection in Control Window, and is visible in the Control Window in the upper right corner of the selected signal icon:
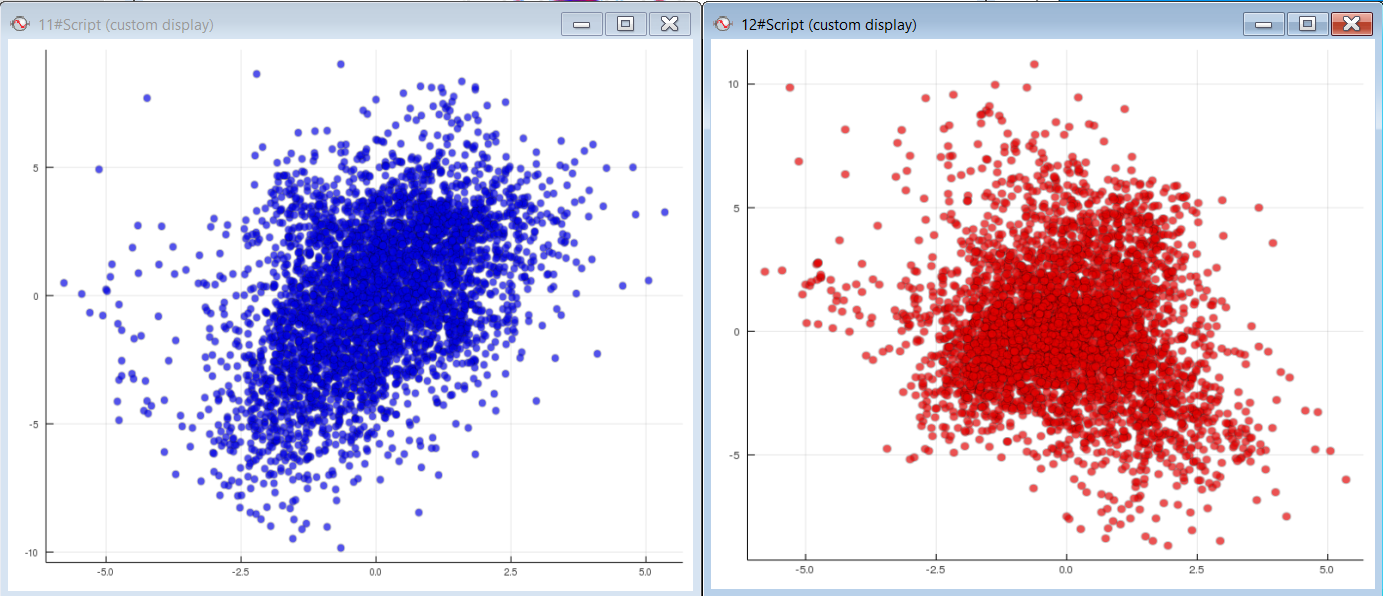
Here are some examples of scatter plots:
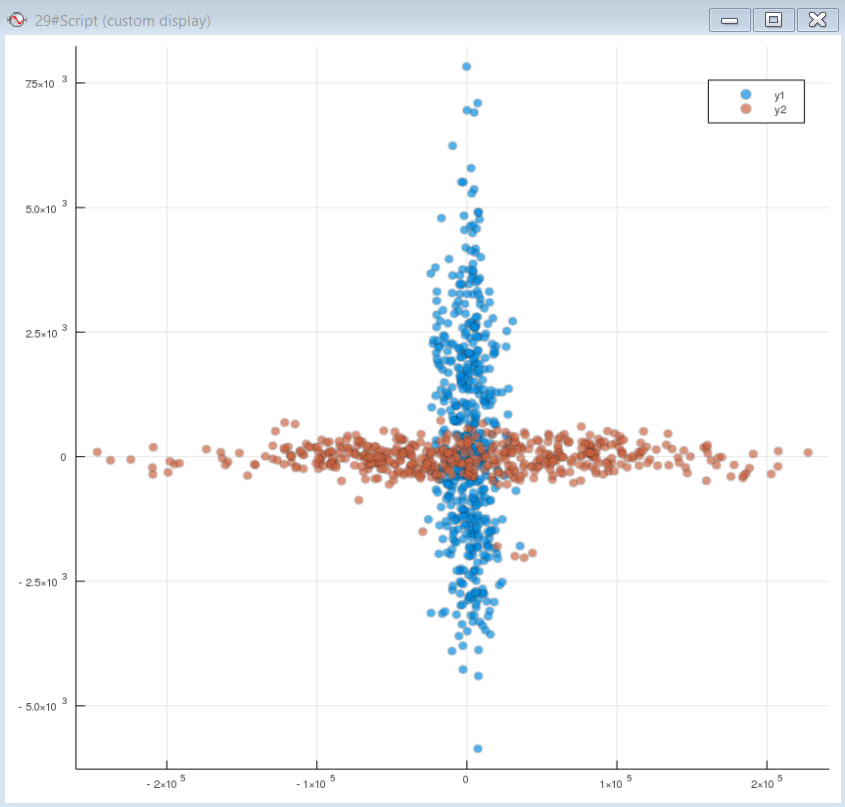
If multiple signal pairs are selected (i.e. 4, 6, 8,... signals), then multiple scatter series will be displayed in one plot. The legend in the upper right corner will provide the information about marker color used to display each series. Each pair of signals must have the same length. The following plot is an example of such plot for 4 selected signals (two pairs):
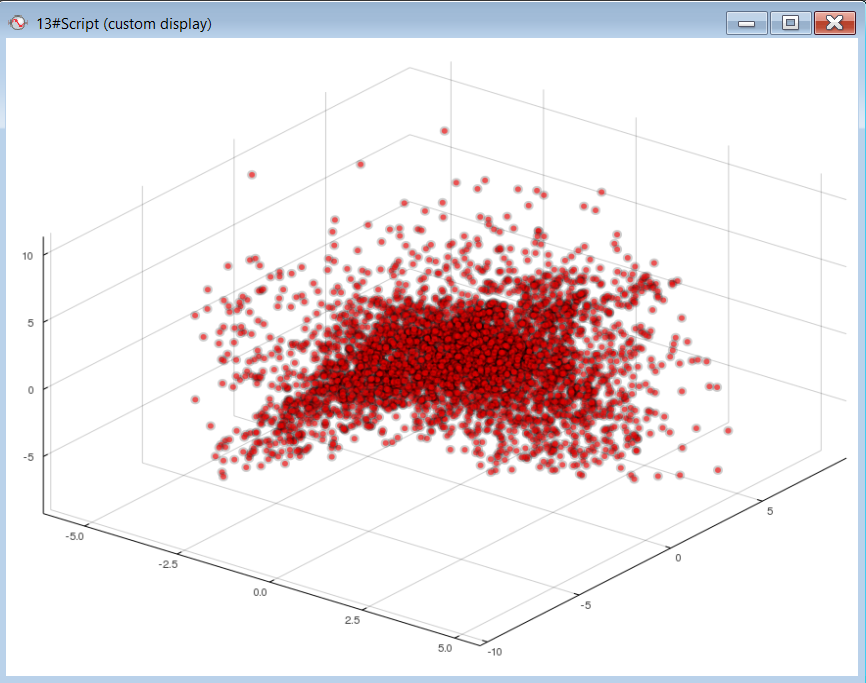
Scatter plot 3D
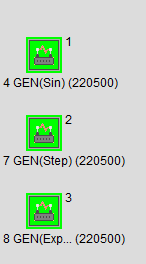
To visualise the relations between three signals, e.g. their values, you can use the "Scatter 3D" tool. You should first select three different signals of the same length in Control Window. After selecting this custom tool, a 3D plot will be displayed. Each point in the plot will be displayed on coordinates corresponding the values from 3 source signals (X=first signal, Y=second signal, Z=third signal). The order of signals is determined by the order of selection, and is visible in the Control Window in the upper right corner of the selected signal icon:
You can also select multiple signal triples and display them in Scatter 3D plot. Each triple will be displayed as a series with a different color.
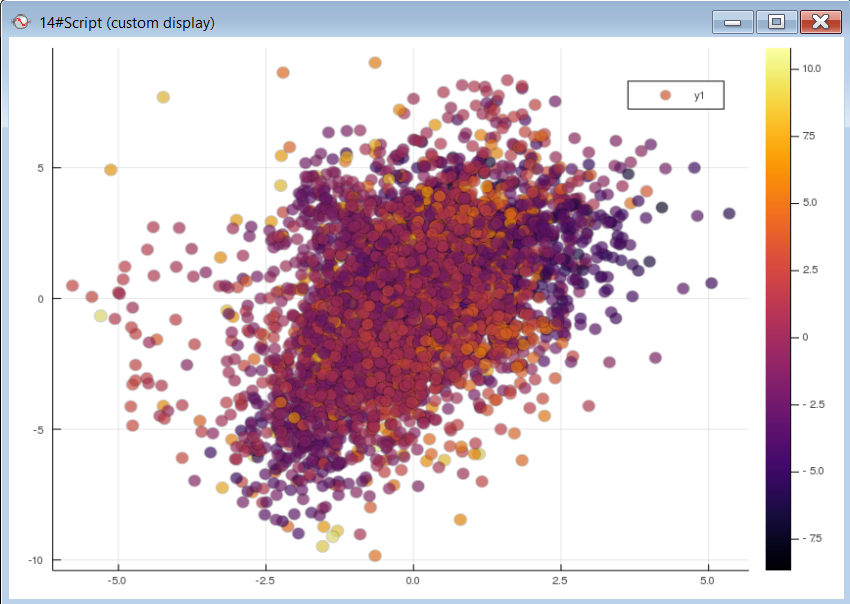
Scatter plot 2D plus color vector
This plot type will take the same input as Scatter plot 3D. But, instead of displaying the values in a 3D plot, it will use a 2D plot for showing X/Y values (as in Scatter plot 2D), but the point will be colored coded based on the Z value. The corresponding color bar for the mapping of Z values to the colors will be displayed next to the plot.
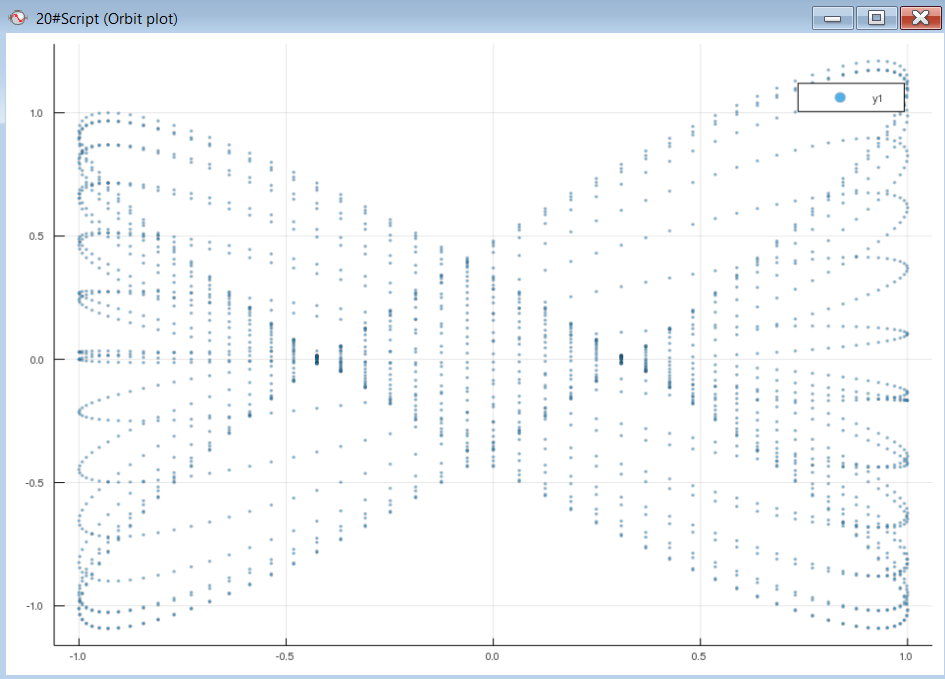
Orbit plot
Orbit plot is very similar as Scatter plot 2D, but uses a different plotting style in order to better visualise issues related to rotating machinery problems.
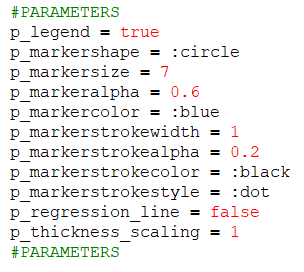
Plot settings
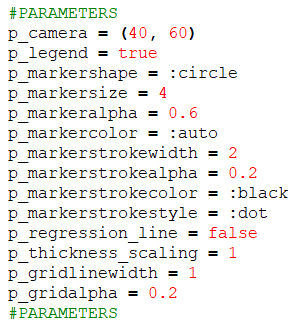
By choosing Edit script... option from a context menu on polar plot display, you can change some plot settings directly in the Julia source code. As soon as you change some parameter and save the script, it will be changed and updated:
Scatter 2D plots:
Scatter 3D:
For more information about possible parameter values, see https://docs.juliaplots.org/latest/generated/attributes_series/ and https://docs.juliaplots.org/latest/generated/attributes_plot/