Probability distribution/Histogram
Accessible through the “Signal tools/Probability distribution/Histogram” menu option or the  toolbar button.
The Probability distribution/Histogram function divides a signal’s amplitude range into consecutive segments (bins) and calculates the probability of signal value to fall into a certain segment or the count of value occurrences falling in that segment.
The resulting curve displays bins (i.e. their lower limit values) at the X-axis and probability in the [0,1] range or number of values on the Y-axis.
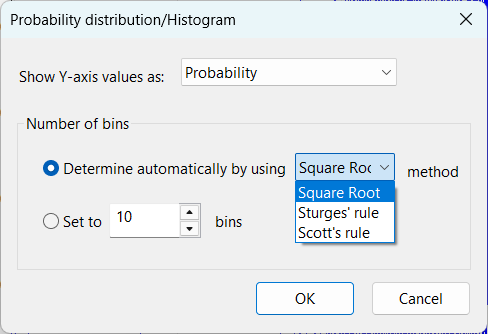
The following settings can be made in the corresponding dialog:

Show Y-axis values as combo-box: Determines if probability or number of occurrences in one segment will be displayed.
Number of bins: This is a crucial setting for the calculation of a distribution/histogram graphic. It determines in how many segments will the signal's amplitude range be split, i.e. how many different values (bins) will be displayed on the X-axis. You can let SIGVIEW determine that number automatically by using one of following algorithms:
• Square Root: Number of bins is equal to sqrt(number of samples)
• Sturges Rule: Number of bins is equal to log2(number of samples) + 1
• Scott's Rule: Number of bins is equal to 3.49 * stdev(input signal)/<number of samples>3
You can also manually set the number of bins to a fixed value (in the range 5...10000).
Editing properties
By using the “Properties...” option in the context menu on the already created “Probability distribution/Histogram” window, you can change any calculation parameter and recalculate the content of the window.
The “Probability distribution/Histogram” window default display type will always be "Histogram". You can change it by using Signal display options.
