Box plot/Violin plot
Box and Violin plots are different methods for plotting numeric data.
See
https://en.wikipedia.org/wiki/Box_plot
https://en.wikipedia.org/wiki/Violin_plot
for details about the meaning of these plots.
SIGVIEW includes several Julia-based custom tools for displaying these plots. You can apply these tools to one or more input signals (from Control Window).
The plot is generated by using Julia plotting functions and is embedded inside SIGVIEW window. Therefore, it does not provide any interactive functions like cursors or context menus.
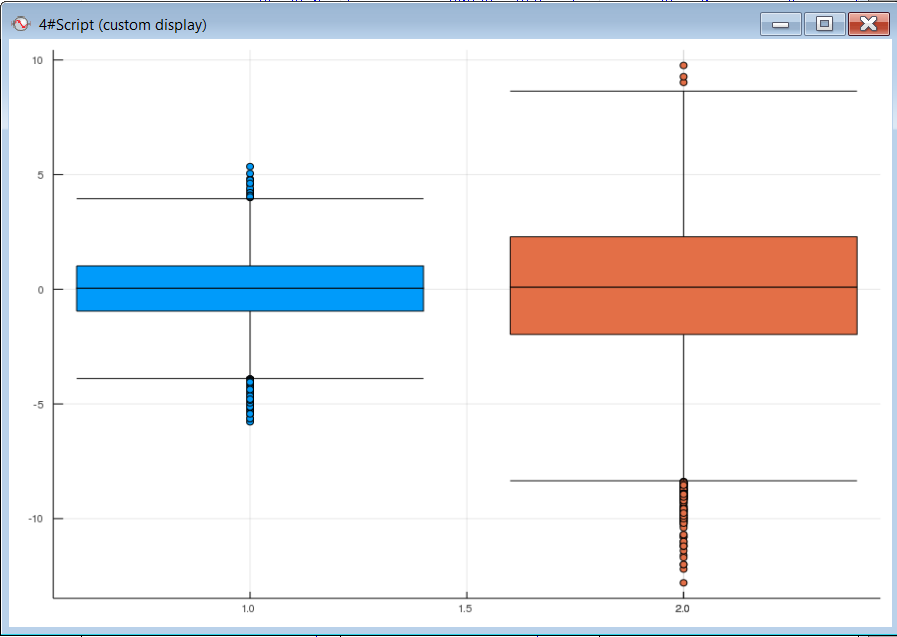
Box plot
Displays Box plot for one or more input signals.
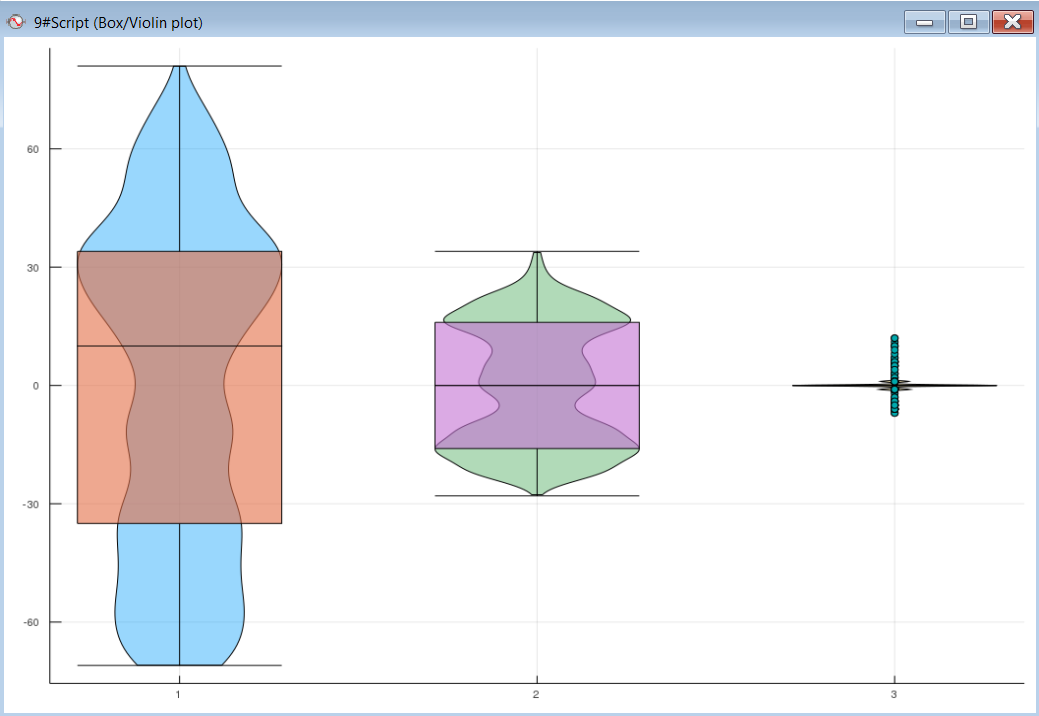
Box plus Violin plot
Displays Box plot as an overlay over the Violin plot.
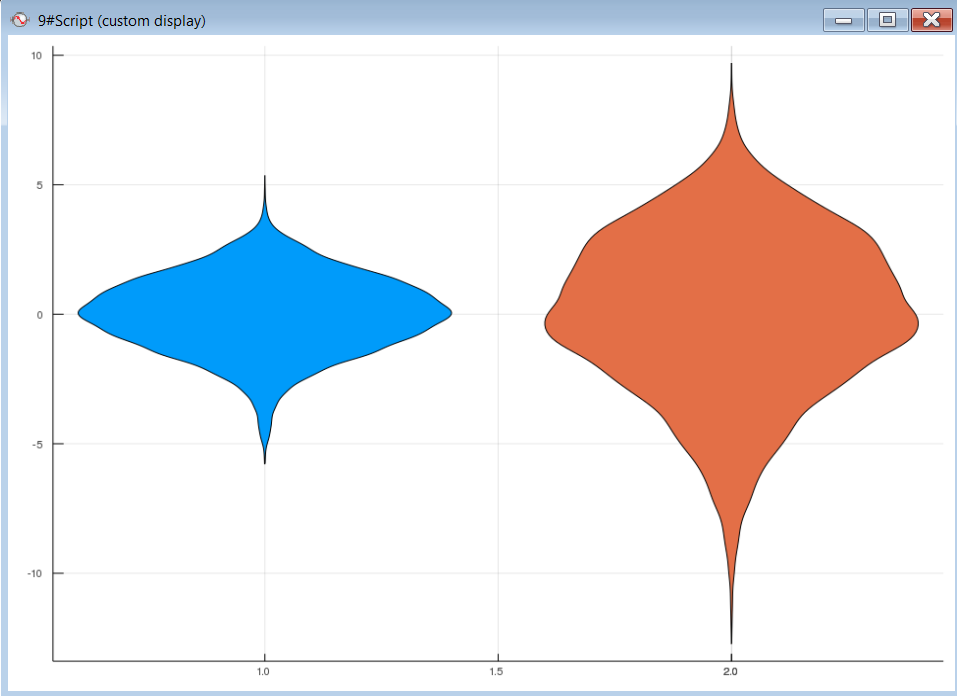
Violin plot
Displays Violin plot from one or more source signals.