Annotations
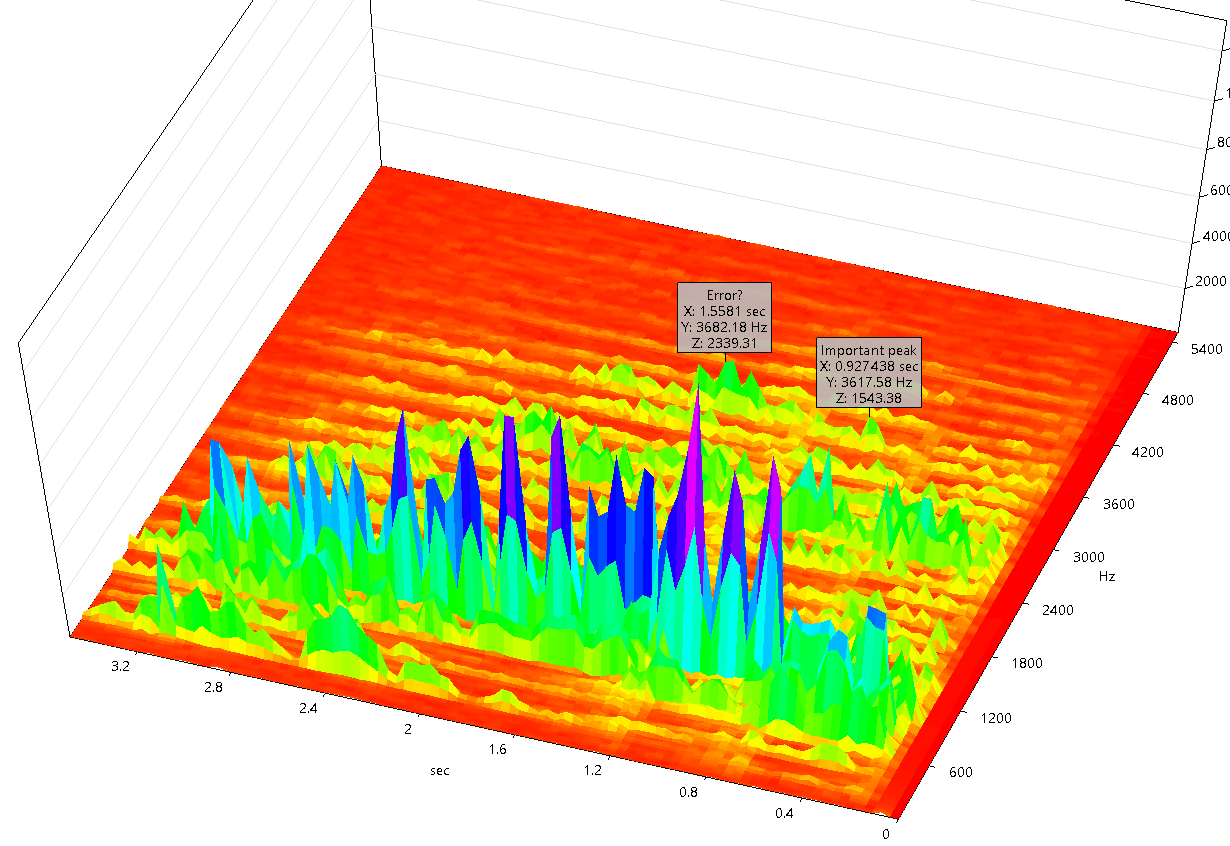
SIGVIEW supports displaying user-defined annotations directly inside 3D plots and Spectrogram views, allowing you to label important time-frequency or time-amplitude positions in the same way annotations can be added to standard signal windows. This enhancement makes it possible to document events, spectral peaks, transients, or anomalies directly within complex 3D visualisations.
Annotations in 3D/Spectrogram windows work similarly to annotations in standard signal windows - see Signal Annotations chapter for the basic concept and interaction model.
Creating Annotations in 3D Graphics or Spectrogram View
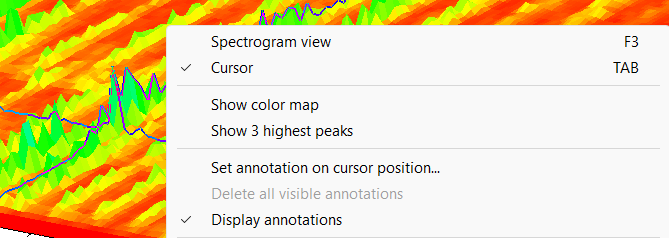
To create an annotation in a 3D window:
- Move the 3D cursor to the desired position.
- Right-click within the window.
- Choose Set annotation on cursor position… from the context menu.
- Enter up to 32 characters of text for the annotation label.
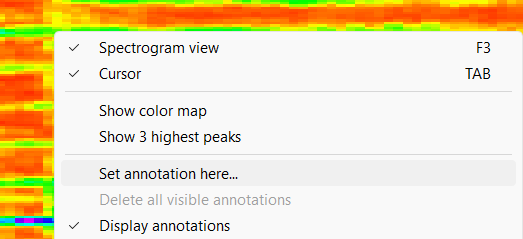
To create an annotation in a spectrogram window:
- Move the mouse cursor to the desired position.
- Right-click within the window.
- Choose Set annotation here… from the context menu.
- Enter up to 32 characters of text for the annotation label.
The annotation appears as a captioned pointer at the selected time/frequency or time/index location.
As in 2D windows, annotations are stored automatically in your workspace and restored when the workspace is reopened.
Editing and Deleting Annotations
You may edit or delete an annotation in a Spectrogram windows by:
- Right-clicking directly on the annotation label.
- Choosing:
- Edit annotation text…
- Delete annotation
- Delete visible annotations (removes all annotations currently in view)
The editing behavior matches that of 2D annotations.
Note: Automatically created markers (e.g., from Peak Detection) cannot be modified or deleted manually.
Note: In a 3D graphics mode, only Delete visible annotations context menu option can be used to delete annotations.
Visibility and Display Options
You can control annotation visibility using the context menu option:
- Display annotations
This toggles annotation rendering on or off within the current 3D/Spectrogram window.
This is useful when preparing screenshots or when annotations obstruct important visual details.
Saving and Workspace Behavior
Annotations in 3D and Spectrogram windows are saved automatically when storing a workspace (SWS), identical to how annotations are preserved in 2D signal windows.
When reloading a workspace:
- All annotation positions, texts, and visibility states are restored.
- Annotations remain linked to the underlying 3D/spectrogram data even if display settings (palette, color scale, axes options) are modified.
Use Cases
Annotations in 3D and Spectrogram windows are particularly useful for:
- Marking spectral peaks or harmonics visible in Time-FFT slices
- Highlighting transient events visible in the time–frequency plane
- Documenting resonances, order components, or fault signatures
- Tagging region-of-interest areas for later extraction or comparison
- Preparing annotated 3D graphics for reports or presentations