3D Graphics: Basic Operations and Zooming
SIGVIEW provides a wide range of display and interaction options for 3D graphics, allowing you to explore, analyze, and fine-tune your data visualization with ease. Below is an overview of the main tools available for navigating and customizing 3D graphics.
Rotation
To view the 3D graphic from different angles, you can rotate it using:
•Arrow keys on the keyboard
•Mouse wheel
Note: Rotation is only available when the 3D graphic is not in cursor mode (see below for details).
Display options
Most 3D display settings and navigation tools are accessible via the toolbar or context menu.
![]()
Surface display types
SIGVIEW supports multiple ways of rendering the 3D surface. You can switch between the following display modes:
•Lines view (![]() )
)
Displays only vertical lines for each data column, colored based on amplitude. This is the fastest rendering mode.

•Wireframe view (![]() )
)
Shows a grid of rectangles forming a surface, colored by amplitude.

•Polygon view (![]() )
)
Displays a full surface using shaded polygons colored according to amplitude values.

•Mesh view (![]() )
)
Combines a shaded polygon surface with a single-color wireframe overlay for clearer structure.

•Lighting (![]() )
)
For polygon-based displays, you can enhance the visual depth by enabling lighting effects via the lighting toolbar button. This adds shading for a more realistic 3D appearance.


Line width (![]() )
)
You can adjust the line width for display modes that include lines (Lines, Wireframe, and Mesh) using the dedicated toolbar buttons.


Cursors
The cursor tool allows precise inspection of data points, zooming into specific regions, or extracting signal slices from the 3D graphic.
•Enable cursor mode by pressing the Tab key or clicking the cursor icon in the toolbar (![]() )
)
•Use arrow keys to move the cursor.
•The current X, Y position and f(X, Y) value appear in the status bar.
•Press Shift + Arrow keys to move the cursor 10× faster.
•In Spectrogram View, cursor can also be moved to another position by simply click on it with the mouse


Zooming In and Out
There are multiple ways to zoom in and out of 3D graphics and spectrograms:
In Spectrogram View:
oMouse rectangle selection to define zoom area.
oUse the “Edit / Zoom in” option or toolbar button to zoom into the selected region.
oUse “Edit / Zoom out” or the Zoom Out toolbar button (![]() ) to return to the previous zoom level.
) to return to the previous zoom level.
oUse the mouse wheel for quick zooming in/out.
oAfter zooming, use Shift + Arrow keys to move the visible area across the full graphic.
In 3D View:
oWhen in cursor mode, zoom will center around the cursor position.
oUse “Edit / Zoom out” or the Zoom Out toolbar button (![]() ) to return to the previous zoom level.
) to return to the previous zoom level.
oAfter zooming, use Shift + Arrow keys to move the visible area across the full graphic.
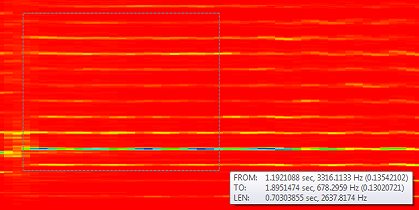
Measuring rectangles in a spectrogram
To measure the time and frequency span between two points:
•Use mouse rectangle selection while holding the Ctrl key.
•A measurement box will appear with details of the selected area.
•No zooming will be performed in this mode.
Zoom-in the graphical content of the window (![]()
![]() )
)
To zoom in or out on the visual content only (without changing the underlying data):
•Use the Graphical Zoom In/Out toolbar buttons.
•This affects only the rendering scale, not the actual data resolution.
Palettes & Colors (![]() )
)
SIGVIEW provides a variety of color palettes for customizing 3D and spectrogram displays. For full details, see Palettes and Colors chapter.
Adjusting Z-axis (![]() )
)
When a 3D graphic is redrawn (e.g., due to changes in the source signal), the Z-axis range may no longer reflect the current data range, if automatic axes scaling is turned off (see Axes Settings (3D Graphics)). This can cause The graphic to shift out of view or incorrect color mapping
To fix this, go to “3D Tools / Adjust Z-axis”. This will recalculate the minimum and maximum Z values, restoring proper visibility and color accuracy.
Exporting 3D graphic values in file
By using the options “File/ASCII/CSV files/Export 3D-graphics”, you can export all values from the visible part of the 3D graphic in a one file. There are 3 options: export in a file with X,Y,Z triples in 3 columns (tab delimited), as a matrix where the first row contains X values, the first column Y values and the rest of the file are Z values in a tab delimited table, and finally, inverted variant of the second matrix format (with switched rows and columns). All of these file types can be loaded by, for example, MS Excel for further analysis.
You can export the data from the visible portion of a 3D graphic via:
"File / ASCII/CSV files / Export 3D-graphics"
Three export formats are available:
1.X, Y, Z triplets – Tab-delimited columns.
2.Matrix format – First row contains X values, first column contains Y values, and the rest are Z values.
3.Inverted matrix – Like the matrix format, but with rows and columns switched.
All formats are compatible with spreadsheet tools like Microsoft Excel for further analysis.
Copying 3D graphic values to the clipboard
Use “Edit / Copy data to clipboard” to copy the 3D graphic's current data view. The format is the same as the matrix export:
First row = X values
First column = Y values
Table body = Z values (amplitudes)
This allows for easy pasting into spreadsheet or data analysis software.
Displaying color map
Select "3D tools/Show color map" from the context or main menu.
The color map visually represents how color values correspond to amplitude levels.


To display the color map by default for all new 3D graphics or spectrograms, enable the corresponding setting in the Application settings dialog.