Extracting Signals (Slices) from 3D Graphics
In SIGVIEW, you can extract a cross-section of data from a 3D graphic or spectrogram and view it as a standard 2D signal. This is particularly useful for analyzing how a specific frequency component evolves over time, for example by extracting all values at a fixed frequency from a time-frequency (FFT) spectrogram.
SIGVIEW provides multiple ways to extract such slices:
Extracting a slice using the cursor:
1.Make sure the 3D graphic is in cursor mode.
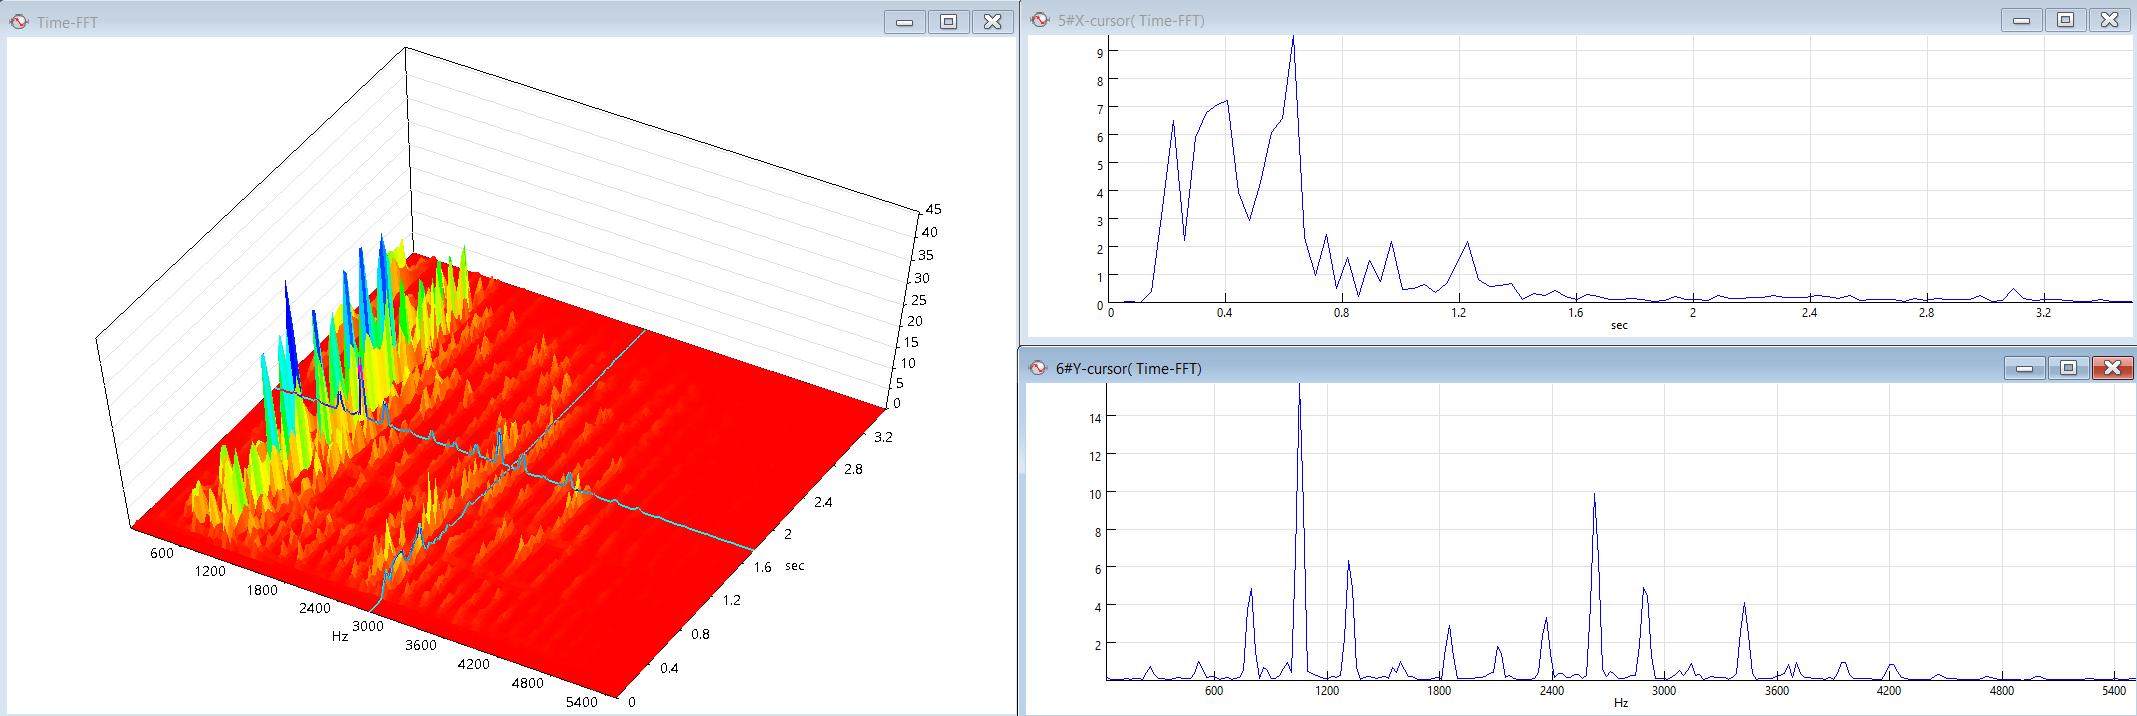
2.Position the cursor at the desired X or Y location in the 3D view.
3.Go to “3D Tools/Extract X(Y) cursor” in the menu.
SIGVIEW will create a new signal window displaying all values along the current cursor position. This extracted signal is dynamically linked to the 3D graphic—moving the cursor will immediately update the signal to reflect the corresponding slice. If you turn off cursor mode, the extracted signal remains visible and retains the values from the last cursor position.
Extracting slices from maximum positions:
In addition to manual cursor-based extraction, SIGVIEW also provides automatic extraction functions:
•Extract slice from max X position
•Extract slice from max Y position
These functions automatically locate the position of the maximum value along the respective axis (X or Y) in the 3D graphic or spectrogram and extract the corresponding slice. No cursor positioning is required.
A new signal window will be created showing the extracted slice at the detected maximum position. Unlike cursor-based extraction, these slices are static and represent the state of the data at the moment of extraction.