Video Tutorials
To help you get up to speed quickly and easily, we offer a variety of video tutorials that cover the basic concepts of SIGVIEW and help you shorten the learning curve. These tutorials are designed to be informative and engaging, providing a visual guide to the software's features and capabilities. Clicking a link will open the video in a new browser tab for an external video hosting website.
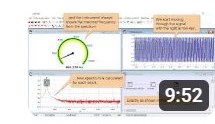
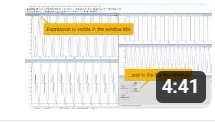
First part of the SIGVIEW Screencast Series. Covers the fundamental UI concepts and workflow: loading signal files, navigating the workspace, and using core analysis windows. A starting point for new users.
(Uses older SIGVIEW version, but the basic concepts are the same)
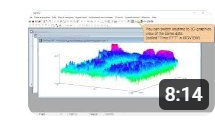
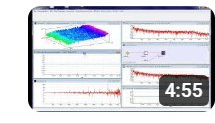
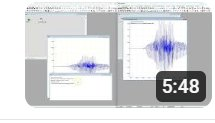
Second screencast covering frequency-domain visualization. Demonstrates spectrogram and Time-FFT functions and the 3D graphics display options with various rendering modes (surface, mesh, lighting).
(Uses older SIGVIEW version, but the basic concepts are the same)
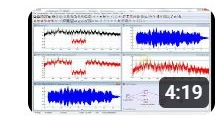
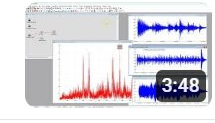
Shows how to apply FFT and IIR filters (lowpass, highpass, bandpass, bandstop) to a signal. Covers filter parameter setup and real-time preview of the filtered result.
(Uses older SIGVIEW version, but the basic concepts are the same)
Demonstrates live signal capture from sound cards and professional DAQ devices. Covers DAQ dialog configuration, trigger settings, and real-time display during acquisition.
(Uses older SIGVIEW version, but the basic concepts are the same)
Julia Language scripting with SIGVIEW (v4.0)
Shows how to use SIGVIEW's embedded Julia scripting interface to extend functionality — adding custom analysis functions or displays.
(Uses older SIGVIEW version, but the basic concepts are the same)
SIGVIEW v6.0, New Features
Brief overview of features introduced in v6.0, including the integrated Julia plots and new ASCII/CSV Import.
(Uses older SIGVIEW version, but the basic concepts are the same)
'3D Signal Filter' SIGVIEW function (v7.1)
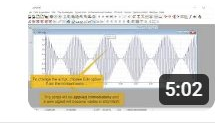
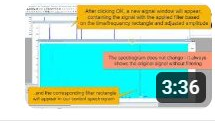
Demonstrates the 3D Signal Filter (PRO edition feature), which allows free selection of filter regions across time, frequency, and amplitude in a 3D/spectrogram view — useful for non-stationary interference removal.
(Uses older SIGVIEW version, but the basic concepts are the same)
Calibration in SIGVIEW (v7.1)
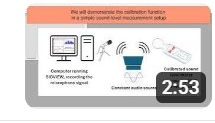
Explains how to apply calibration to raw A/D input so physical units (e.g., Pa, m/s²) are correctly displayed. Covers calibration file setup and how it propagates through analysis instruments.
(Uses older SIGVIEW version, but the basic concepts are the same)
Signal Calculator in SIGVIEW (v7.1)
Covers the Signal Calculator tool, which allows combining signals and analysis results through arithmetic and cross-spectral expressions — analogous to a standard calculator but operating on signal/instrument windows.
(Uses older SIGVIEW version, but the basic concepts are the same)
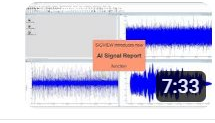
SIGVIEW AI Signal Report — Let an AI Engine Explain Your Signal (New in v9)
Introduces the AI Signal Report feature where an LLM (large language model) analyzes exported signal metrics and generates a natural-language explanation of the signal characteristics. Addresses the gap between LLMs and domain-specific signal data.
Stream Live Data Between SIGVIEW Instances Over a Network (New in v9)
Shows how to stream live acquisition data from one SIGVIEW instance to another over a network connection, enabling remote monitoring without file transfers or additional middleware.
Creating and Reusing Custom Tools with SIGVIEW
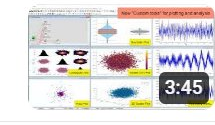
Demonstrates how to build and save Custom Tools — preconfigured analysis workspaces combining instruments, layouts, and settings — for reuse across different signals or sharing with other users.
Screenshots
The following screenshots illustrate SIGVIEW's graphical capabilities and key analysis functions.