Persistence signal display
The software feature known as "Persistence Display" enhances analysis window display by allowing users to view historical signal values overlaid on current data. This function operates by gradually fading out older data points to give prominence to newer measurements, creating a visual history of signal changes over time. It's particularly useful in identifying patterns, trends, and transient phenomena that might otherwise be missed in real-time analysis. By retaining past signal values on the graph, users gain insights into the temporal dynamics of the signals they are monitoring, making it easier to compare current data against historical performance. The Persistence Display serves as a powerful tool for in-depth signal analysis, providing a comprehensive view of signal behavior over extended periods.
You can turn persistence display option on each analysis window by clicking on the ![]() button in the toolbar or Edit/Persistence display... menu option. After analysis result changes many times, the content of the window may look like this:
button in the toolbar or Edit/Persistence display... menu option. After analysis result changes many times, the content of the window may look like this:

or in the black color scheme:
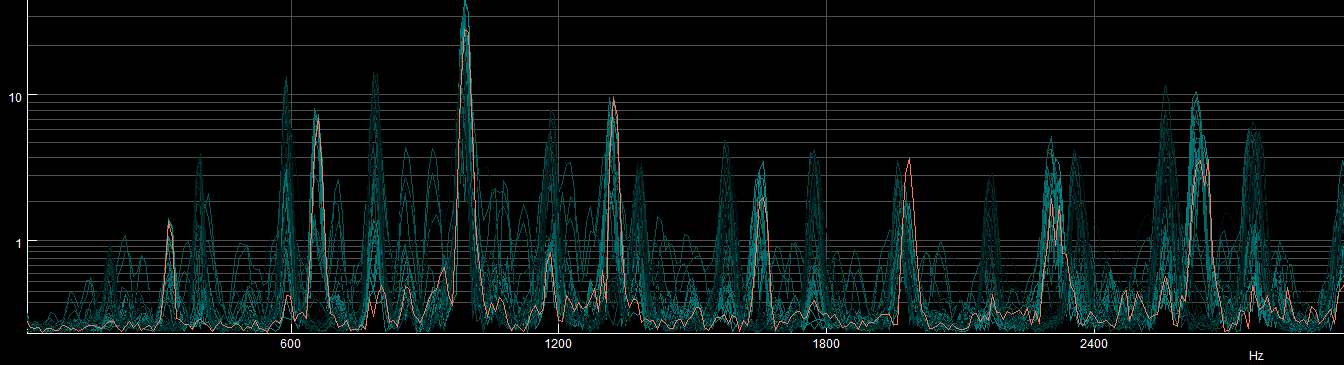
The last/current analysis result will be displayed by using the usual color (red in upper example), and past traces are displayed with a complementary color, a light blue overlay in the upper example.
Older traces are displayed with "lighter", i.e. less visible color.
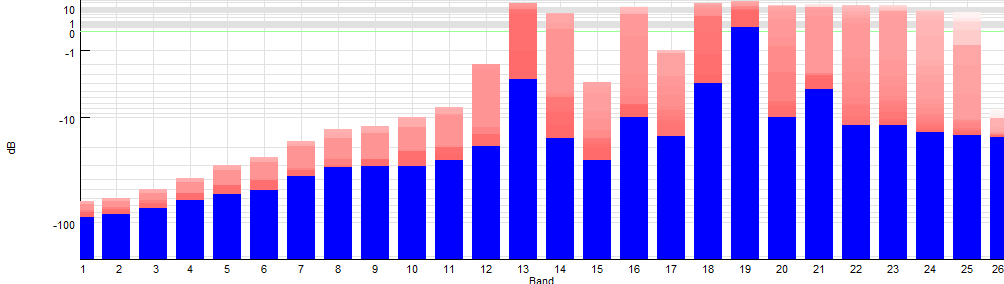
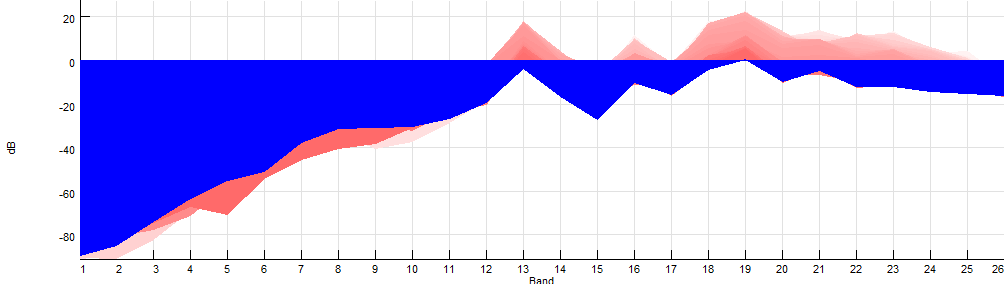
Persistence display can also be used with other display/line types. Here are some examples:


If the overall length of a signal or analysis result changes, its persistence display will reset and clear all past traces.
Note: Keeping past traces can consume a lot of memory and displaying traces can slow down the display significantly. Therefore, using this option is recommended only for relatively short analysis results, typically with less than 100K values.
You can change the parameters of the persistence display by using Edit/Persistence display settings... menu option. After selecting this option, the following dialog will appear:

You can change the following parameters to affect the appearance of the persistence display:
Show persistence display traces: Select this check-box to see traces display, unselect it to turn the persistence display off
Number of traces: Select number of traces ('last analysis results') to be displayed. Maximal number of traces you can display is 100.
Color lightness: Sets the lightness (or darkness for the black color scheme) of the color used to display the traces. Higher value will cause traces to be less visible.