Various FFT variants
Several custom tools are included to demonstrate how different FFT calculations can be created and saved as custom tools.
FFT with averaging
This tools calculates FFT Magnitude with averaging option turned on, splitting signal in 10 segments with 25% overlap, calculating FFT, and averaging the results
Welch's periodogram
Basically the same as FFT with averaging, except Power Spectrum Density is calculated instead of Magnitude
FFT normalized and smoothed
This tools calculates FFT with some options turned on: removing linear trend and peaks from the input signal and smoothing FFT result with a 15 samples long moving average. filter, removing peaks outside
FFT smoothed
Similar as the previous one, but without operations on the input signal.
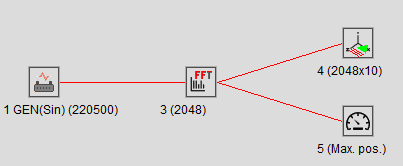
FFT with 3D and max marker
This tools calculates FFT by using default settings and creates two more windows: one instrument window displaying a dominant frequency from the FFT, and a second one for tracking all calculated FFTs in a 3D graphic.
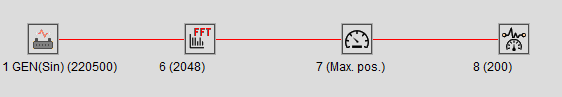
FFT with max marker and max tracking
This tools calculates FFT by using default settings and creates two more windows: one instrument window displaying a dominant frequency from the FFT, and a second one tracking all max. frequency values in a signal.
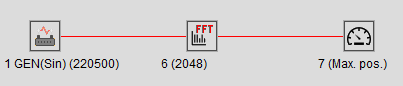
FFT with max marker
Similar as a previous tool, but without tracking max. frequency values.