3D Signal Filter
If you need to apply a complex set of filters to your signal, each one with a separate time/frequency range and amplitude, you can use “3D signal filter" function. It is named "3D" because it enables you to define filter properties in 3 dimensions: time, frequency, and amplitude.
To filter the signal, select the "3D tools/3D signal filter" main menu option. As a result, a spectrogram window of the origin signal will appear. It is completely the same as a normal spectrogram window, except that the default colours will be inverted and the name of the window will be "3D filter...". This spectrogram will be a starting point to define filter properties.
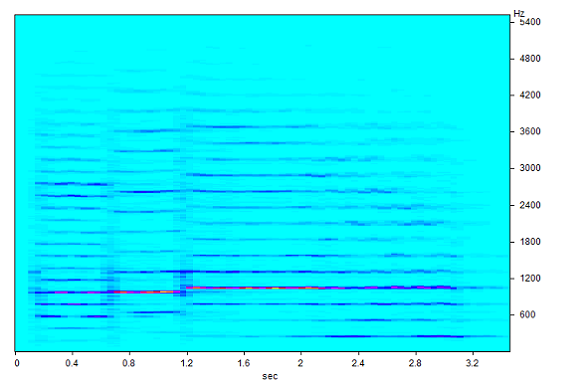
In this spectrogram window, you can use your mouse to select the time/frequency rectangle where you want to increase or decrease a signal amplitude. After selecting a time/frequency rectangle, the following dialog for defining filter properties will appear:
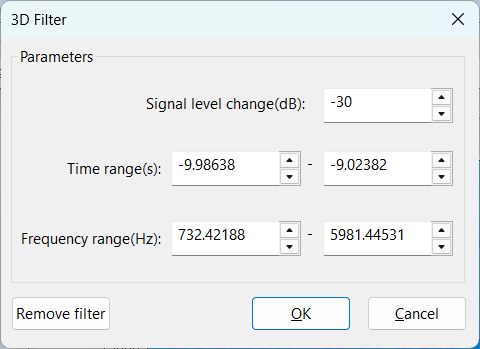
You can define how the amplitude of the selected time/frequency rectangle should be changed (increase or decrease amplitude in dB) and you can fine-tune the time/frequency range.
After pressing OK, your filter rectangle will be displayed in the spectrogram window and a filtered time-signal will be created as a child signal of the "3D filter" spectrogram window. A new window with the filtered signal will be named "Multi-filter".


You can modify filter properties at any time by clicking on the filter rectangle in the spectrogram and changing the values in the dialog. The values will be applied immediately to the filtered time-signal.
If you want to delete a single filter rectangle, simply click on it with the mouse to open its properties dialog and click on the "Remove filter" button.
You can add as many filter rectangles to the 3D filter as you want, even if they overlap. All filters will be applied simultaneously to the filtered time-signal.
If you close the resulting time-signal, you can open it again by using a corresponding context menu option on the 3D filter spectrogram window.
To use mouse rectangle selection for a zoom function, as on all other spectrogram views, just hold down the Ctrl key during selection.
Example
Let us take a simple pure white noise signal and model its spectrum by using the 3D signal filter function.
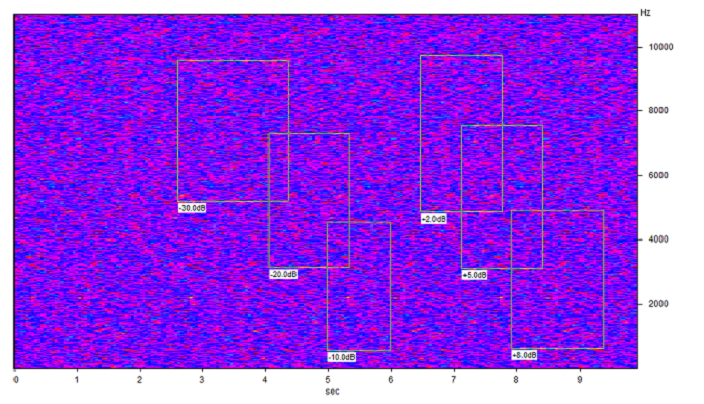
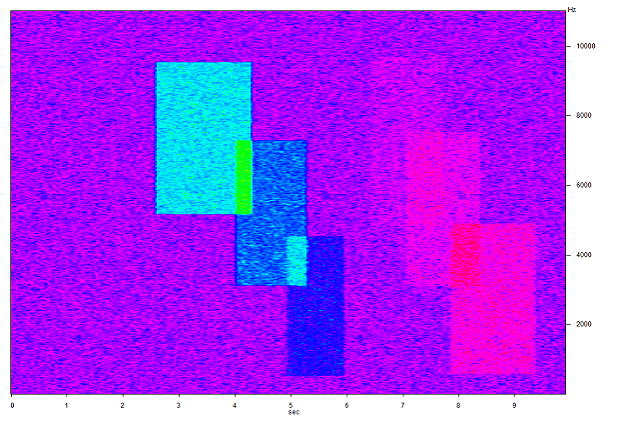
After generating a white noise signal and selecting the "3D signal filter" option, you will see a basically flat spectrogram. We will define multiple overlapping filters, some with gain (+2, +3, +8 dB) and some with attenuation (-10, -20, -30 dB).
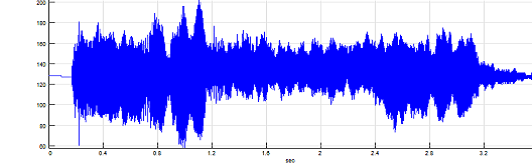
On each change of filter scenario, a resulting signal will be calculated and updated. Finally, it will look like this:
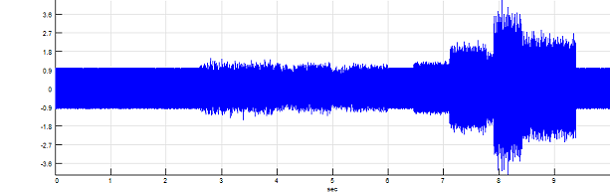
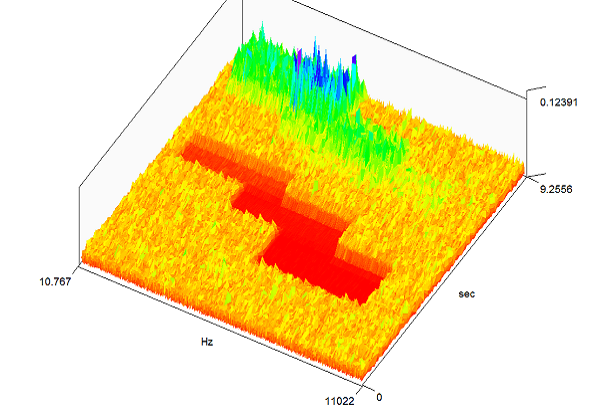
If you now calculate a Time-FFT or spectrogram of the resulting signal, you will see that its spectral shape changed exactly according to the filter scenario defined in your 3D signal filter window. On time/frequency parts where single filters are overlapping, the result will be a sum of all overlapping filters.
Time-FFT on linear scale:
Spectrogram on a log scale:
This is the workspace used for generating the screenshots:
