Peak Detection
The peak detection function is used to automatically detect peaks in a signal or in an analysis result. It can be started for each signal window from its context menu (right mouse click) or from the main menu option, “Signal tools/Peak detection” (or the  toolbar button).
After selecting the peak detection option, the following dialog appears:
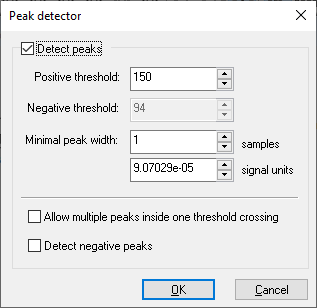
To turn peak detection on for the current window, turn on the “Detect peaks” check box, as shown in the above image.
The following settings can be made for peak detection:
• Absolute amplitude threshold can be set in the “Positive threshold” field. This means that SIGVIEW will only consider amplitudes over that value as possible peak candidates. The default value will be set to 75% of the maximal signal amplitude
• If you would also like to detect negative peaks, enable the “Detect negative peaks” check-box and set the corresponding threshold in the “Negative threshold” field. The value should be entered as absolute amplitude, so you do not need a minus sign
• Minimal peak width can be defined in samples or signal units (for example, Hz, or seconds). Setting this property to a higher value will prevent detection of very small peaks where only few values cross the threshold limit
• Allow multiple peaks inside one threshold crossing option allows SIGVIEW to detect local peaks inside one threshold crossing. Turning this option on will usually result in an increase of detected peak count
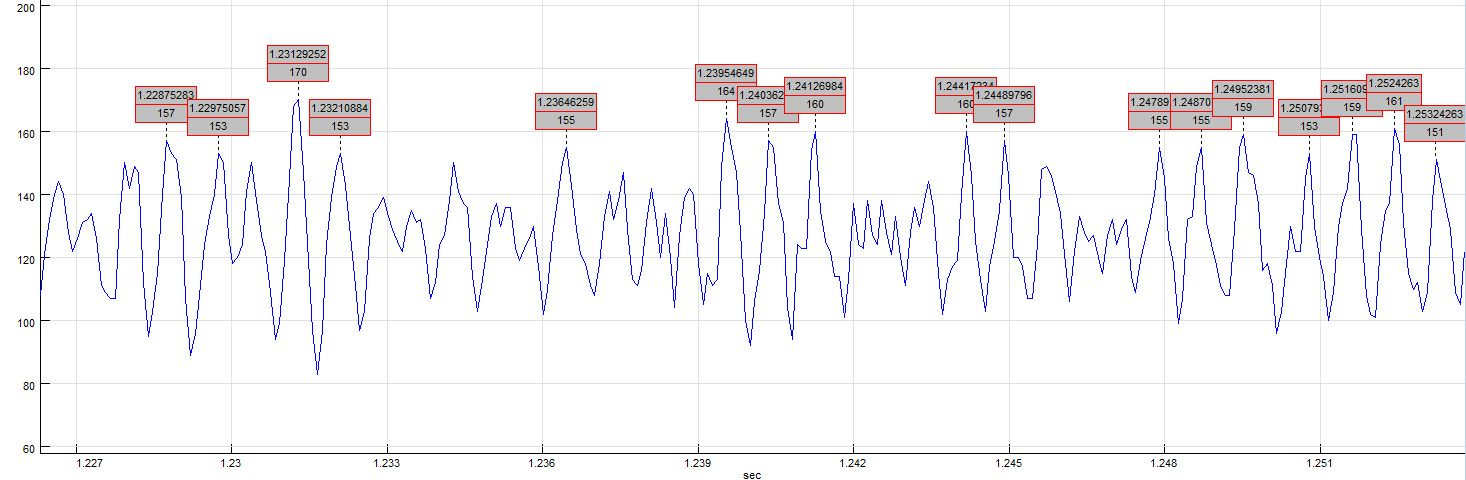
After turning peak detection on and closing the dialog, SIGVIEW will place markers on all detected peaks in the visible parts of the signal. It will look like this:
Each marker shows the X-position of the peak (above) and peak amplitude (below).
By using the Peak count instrument, you can automatically display or track the number of peaks currently detected in the visible signal part.