Custom filter bank plot
To create different equalizer or octave plots for audio analysis, it is often needed to define a bank of band-pass filters with different, possibly overlapping, frequency ranges. This task can be performed by using the "Custom filter bank" option in SIGVIEW.
Creating filter bank files
For each custom filter bank, a definition file with the extension "FLB" is created and stored in the "filters" subdirectory of the SIGVIEW application data directory. Two example files will be stored there during SIGVIEW installation; "octave filter.flb" and "1_3_octave_filter.flb". These files are used for Octave plots functions.
Each FLB file contains multiple rows, each representing one band-pass filter in the filter bank. For example:
14;18;A
18;22.4;B
22.4;28
...
The first row defines a filter with a band-pass from 14-18 Hz. As a label for this band in a SIGVIEW signal display, an "A" will be displayed.
The second row defines a filter with a band-pass from 18-22.4 Hz. As a label for this band in a SIGVIEW signal display, an "B" will be displayed.
The third row defines a filter with a band-pass from 22.4-28 Hz. Since a label is not defined for this filter, a band index, i.e. "3" will be used as a label.
Each filter bank has to contain at least 4 filters in order to be used.
Settings in filter bank files
Besides frequency limits for band-pass filters, you can define some additional settings for the calculation in the FLB file as well. All settings are added as text lines beginning with a "#" character. The following settings are possible:
#X_LABEL: Defining label for X-axis (for example #X_LABEL=Hz).
#Y_LABEL: Defining label for Y-axis (for example #Y_LABEL=dB).
#FULL_SCALE: Defining the value to be considered as a "full scale" value in signal units when calculating energy of the filtered signal in dB (for example #FULL_SCALE=32768).
#LINEAR_VALUES: Is a flag (without parameters) which switches the calculation of energy in single bands from dB to linear values. In that case, the FULL_SCALE option has no effect. It is also possible to switch fast between dB/linear values from the context menu of each octave plot window.
This would be an example of an FLB file with some settings, as described above:
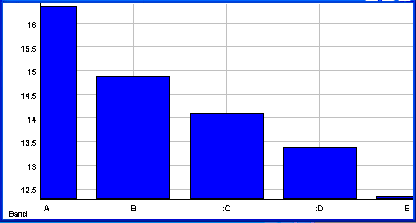
#X_LABEL=Bands
#Y_LABEL=dBFS
#FULL_SCALE=32768
14;18;A
18;22.4;B
22.4;28;C
Please note that the settings’ names are case-sensitive.
Applying filter bank function
To apply one of defined filter bank files to a signal, use the "Signal Tools/Custom filter bank..." menu option and select the FLB file you would like to apply it to.
After a specific filter bank file is applied to a signal, the following procedure will performed:
1. The signal will be filtered with each filter from the filter bank.
2. The energy of the filtered signal (RMS) in dB (logarithmic scale) will be stored as a next value in the "Custom filter bank plot".
3. After all values for all filters are calculated, a plot will be shown. By default, these plots are displayed by using a histogram display type (min-reference). As for all other plots, you can change the display type by using a context menu or toolbar buttons (Display type option).