Instruments, Overview
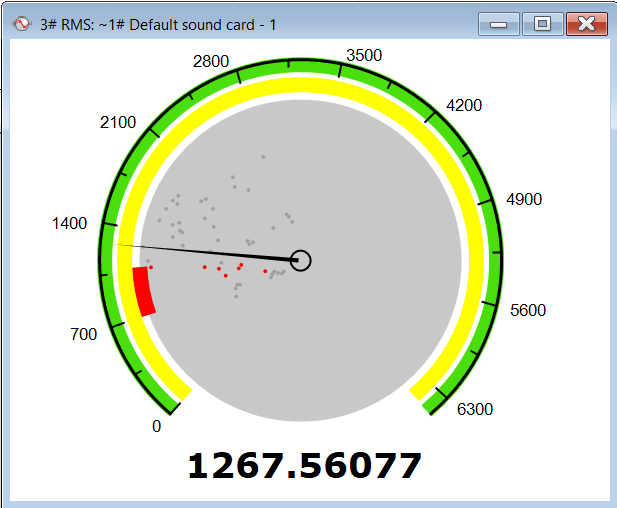
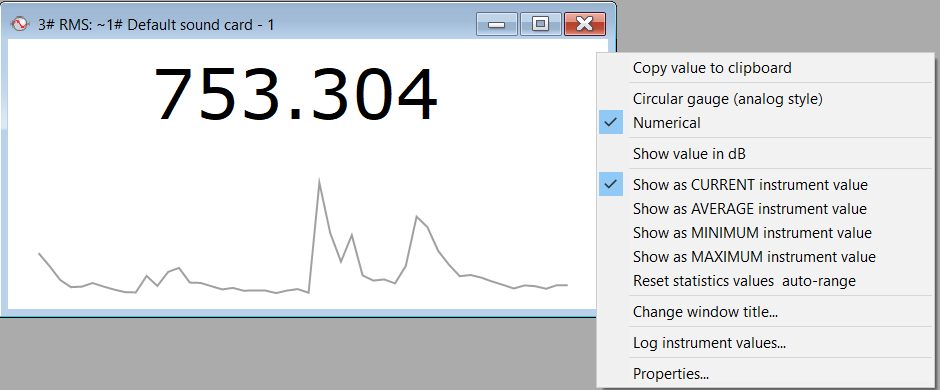
To calculate and monitor changes of some numeric value, you can use SIGVIEW’s instruments. They calculate various values from the signals or 3D graphics and display them as a number or in graphical form as a round-scale instrument.
You can create instruments by using one of the options in the “Instruments and markers” main menu section.
The right-click menu on the instrument window includes many useful options: copying instrument values to the clipboard, logging instrument values, editing instrument properties etc.
To automatically calculate and display the changes of an instrument value in a longer signal, you can also use Instrument values over time function.
For the list of all available instrument types, see Instruments, Types.
Besides displaying a current value, each instrument will also display a last values history and some statistical values. For details, see Instruments statistics and values history
To display statistics values from a signal without creating new windows, you can also use Fast Statistics Report function.