Instrument Properties
By selecting “Edit/Properties” for the Instrument window, you will be able to set some of the following instrument properties:
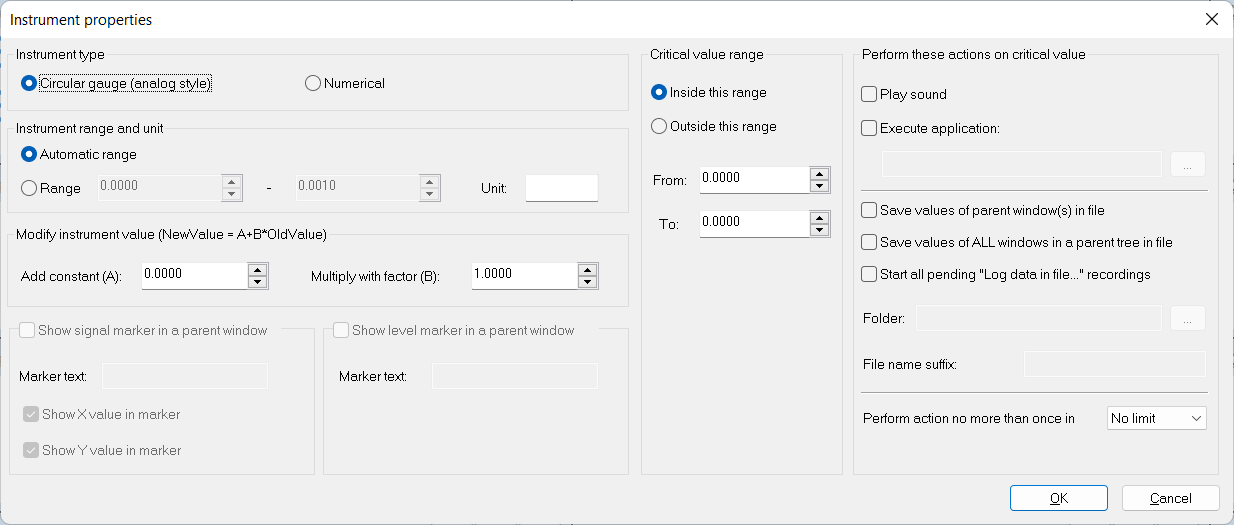
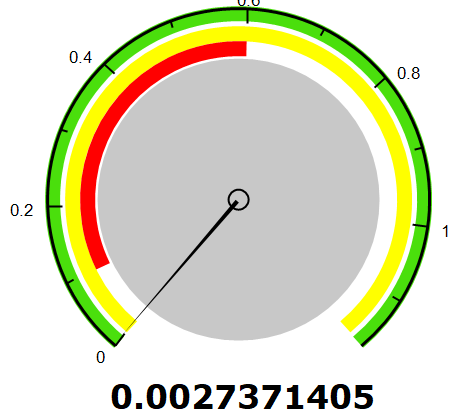
Type: There are 2 types of visual appearance for instruments:
• Circular gauge (analog style)
• Non-graphical, with numerical display only
Instrument range and unit: You can define value range and units (Volt, meter, etc.) for the instrument scale. Default mode for the instrument scale is "Automatic range". It means that the instrument will adapt its scale to fit min/max values from the past. Alternatively, you can also set fixed values for the begin/end of the range.
Modify instrument value: You can define coefficients to modify the instrument value after calculation. This is useful if you need a calculation slightly different than the one included in SIGVIEW; for example, if the unit you would like to use needs some scaling. You can define both add (A) and multiply factors (B). The resulting instrument value will be calculated from the originally calculated value by using the following expression: NewValue = A + B*OriginalValue.
Show signal marker: This option is available only for “At..., Maximum, Minimum, Maximum position and Minimum position” instruments. If you enable it, a marker will appear in the origin signal, showing the exact position for the value shown in the instrument. You can define the content of the marker by changing its text, or turning on the X/Y value display in the marker.
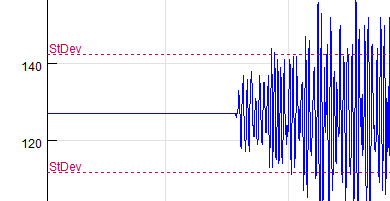
Show level marker in signal: This option is available only for some instruments (Const, Standard deviation, Mean, Median, Quantile, Show value at... ) which value can be displayed on the Y-axis of the origin signal. If you enable this option, a horizontal line will be displayed in the origin signal, showing the instrument value level on the Y-axis.
Depending on the type of instrument, the level marker can be different: Mean instrument will simply show one line at the mean value and the Standard Deviation instrument will show two lines, one at mean+value and one at mean-value. You can freely define the marker text which will be displayed above the marker line.
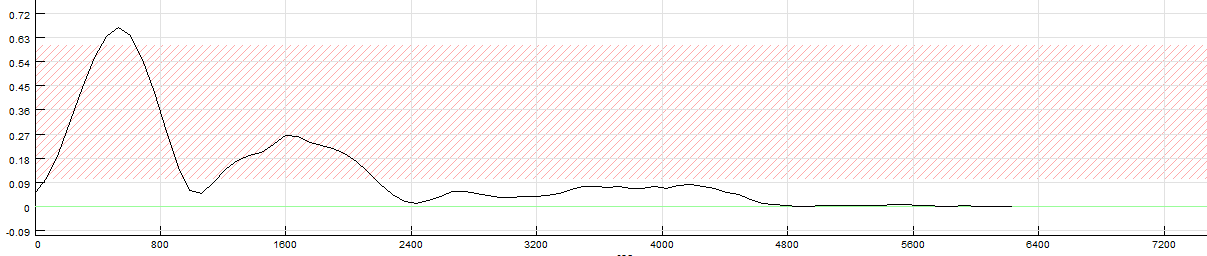
Critical value range: You can select the value range which represents the “red zone”. It will be marked red on the instrument. By selecting the “Outside” option in the radio box, you will invert the selection, i.e. all values outside that range will be marked red. If using a "Log instrument values" function, you will also be able to see the alarm range there as a signal overlay.
Perform these actions on critical values: This part of instrument settings allows you to define which actions should be taken if instrument reaches a value in a defined critical range. The following actions are available:
Play sound: SIGVIEW will play a warning sound (taken from your Windows sound settings) when the value is in a critical zone.
Execute application: You can enter the complete path of an external application to be executed if the value is in a critical range, i.e. if the value of the instrument enters the “red-zone”. You can also define how often this application will be called (see "Perform action no more..." option below). SIGVIEW will execute specified application and pass the current instrument value as a command-line parameter to it. For example, if your application is “C:\MyLogger.exe”, and a value of 45.4432 causes the alarm to go off, SIGVIEW will call “C:\MyLogger.exe 45.4432” command line. This function can also be used to simply log analysis values outside SIGVIEW in some regular intervals (see Example below).
Save values of parent window(s) in file: This option provides a conditional logging of signals or analysis values, depending on the value of this instrument. If the instrument reaches a value in a critical range, all values of its parent window (signal or 3D) will be stored in a file. The file will be stored in the folder defined in the Folder field and will have a file name suffix defined in a File name suffix field. The values will be saved in ASCII format and can be opened in SIGVIEW by using CSV / ASCII import functions (see Loading and Saving ASCII / CSV files).
File names will always be of the form: <prefix>_<event_index>_win<window_id>_<datetime>.txt, ensuring that each new file has a unique name. For example file "test_23_win1_20220307_214633.txt" is saved from a Window with ID=1 (visible in the title bar of a window) from a 23rd triggering from this instrument window, with a "test" suffix.
This function can be used to record signal or analysis values only if some rare event of interest occurs.
You can also define how often the saving of values will be triggered called (see "Perform action no more..." option below).
Save values of ALL window(s) in a parent tree in a file: This option works similar as the previous one, but will save the values of all parent windows of this instrument window into files.
For example, if you monitor a live signal from your DAQ device by scaling the input signal, calculating its spectrum and finally calculating a maximum spectrum value like this:
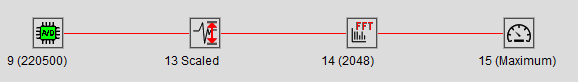
In case maximum value of the instrument reaches a critical range, the values of all three parent windows will be saved in files, so you will be able to reconstruct the complete signal chain in the moment of instrument reaching the critical value.
You can distinguish files stored from different windows by using a window ID parameter in a file name. It is the same ID displayed in the Control Window or in window title (9,13,14,15 in the above example).
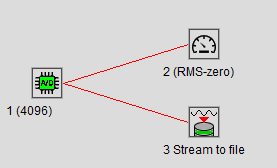
Start all pending "Log data in file..." recordings: By selecting this option, you can choose to start recording in all "Log data in file..." windows currently existing in the Workspace (if not already recording). Typically, you would limit a maximal duration of the recording in the corresponding Log window settings, so that the recording stops automatically after a certain period of time. A typical workspace, enabling you to record your signal if instrument value (RMS in this case) reaches certain level, would look like this:
Perform action no more than once in X sec/min: This option allows you to control how often will the action triggered by reaching the critical value be called. If you do not limit the number of actions, saving values of signals in file can easily produced enormous amounts of data in a short time.
Examples for executing external applications
As an example for the external application, SIGVIEW distribution includes a “Logger.exe” application. You can simply copy this file from the SIGVIEW installation folder to some other folder and enter its path to the instrument dialog. Logger.exe will log the values passed from SIGVIEW in a *txt file with the name SIGVIEWLog_<current date>.txt in its working directory.
Another example for such external application is ULDigital.exe, also included with the SIGVIEW installation. This application can control digital outputs on devices compatible with Universal Library from Measurement Computing®, i.e. can turn external devices on or off. There are the following command line options: ULDigital.exe <duration in ms> <digital output>.
Where <digital output> should correspond with UniversalLibrary's FIRSTPORTA, SECONDPORTA... values. For example, on PMD devices these values are 10, 14, 18... for channels A0, A1, A2... This application requires that the Universal Library driver is installed.