Signal Axes Settings
There are two ways to set the Y-axis range and position in a signal window: a fast method, by using the mouse-wheel directly on a signal, and a standard method by using axes settings dialog from the context menu.
Fast axes settings by using the mouse-wheel method
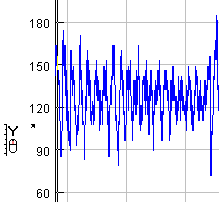
To use the fast Y-axis setting method, move your mouse pointer to the area between the left edge of the signal window and Y-axis display. The mouse pointer will change to show a symbol as on this screenshot:
Turning the mouse-wheel forward will zoom-in the Y-axis around the current position of the small arrow in the cursor pointer. Turning the mouse-wheel in the opposite direction will zoom-out from the Y-axis. Again, the center position for this operation will be the position of the small arrow in the mouse pointer.
If you press the Ctrl button during the mouse-wheel moving, the Y-axis will move up or down instead of zooming-in or out.
Axes settings dialog
Axes settings for signals can also be performed in Axes settings dialog, which appears after selecting the “Edit/Axes settings” option or pressing Ctrl+A on an active signal window. There are several fields in this dialog:
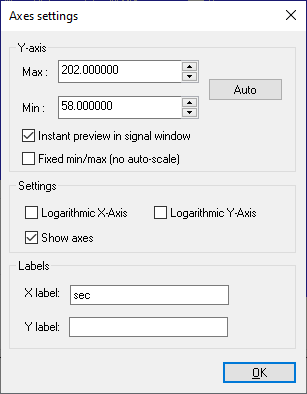
Max & Min fields are used for setting the Y-axis range. You can enter your own values manually in the corresponding edit boxes or you can change the values by pressing the up/down arrow keys on the right side.
Auto button sets values in min/max fields to actual min/max values from the signal.
Fixed min/max (no auto-scale) check box: Unselect this if you want to keep the Y-axis settings for this signal, even if signal values change. If you select this check-box, SIGVIEW will not automatically calculate new min/max values for the Y-axis each time the signal changes.
Instant preview in signal window check box: Select this if you want signal axes to redraw while you change minimum or maximum values in this dialog. This can be a slow operation for long signals.
Show axes check box: Select this if you want to see the coordinate system with X and Y axes and labels. Drawing signal only, without the axes, can speed-up the signal redrawing in cases where performance is very important.
X/Y Labels: a text which appears at X and Y axes (usually units like Hz, s...).
Logarithmic X-axis: If this option is selected, the X-axis will be shown as a logarithmic axis, i.e. the distance between data points will increase logarithmically from the left to the right side of the displayed part of the signal. By using this view on an FFT result, lower frequency components will take more space, and the higher frequencies will be shown “compressed” at the right side of the graphic.
Logarithmic Y-axis: If this option is selected, the Y-axis will be shown as a logarithmic axis, i.e. the distance between data points will increase logarithmically from zero amplitude in a positive or negative direction.
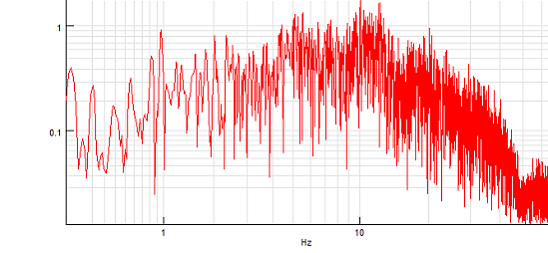
This is an example of a spectrum with log-log display, i.e. both X and Y logarithmic axes:
It is also possible to turn Logarithmic X/Y axis on or off from the context menu on each signal window.
You can choose the default axis setting for logarithmic display for all new signal windows in the Application settings dialog.