Basic Concepts
SIGVIEW sets itself apart from the majority of signal analysis tools by offering a highly customizable user interface rather than a one-size-fits-all solution. It functions as a modular toolkit, enabling users to mix and match different tools to tailor the interface and features to their specific analysis needs. After assembling your desired set of tools into an efficient workflow, you can save this configuration as a "workspace" or "tool" for future use. To fully leverage SIGVIEW's capabilities, it's essential to grasp a few fundamental concepts.
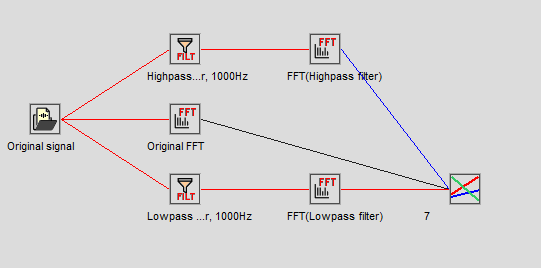
One key concept is the Analysis Chain. In SIGVIEW, signals or the results of signal analysis are interconnected across various windows, forming a functional block sequence - this can include file inputs, data acquisition modules, FFT analysis, measuring instruments, and more. You can imagine signals or analysis results to “flow” through that chain from one tool to another one, following your analysis path. Whenever a window's content is updated, all connected "child" windows automatically refresh and update their displays to reflect these changes. An example of how an Analysis Chain might be visualized is through the Control Window display, showcasing the sequential flow of data through your custom setup:
Visible part of the signal: When you conduct an analysis of a signal window in SIGVIEW, the analysis targets only the segment of the signal currently displayed. This means that any adjustments to your view of the signal - whether scrolling through, zooming in, or zooming out - will prompt all related windows to automatically update and refresh their content to reflect these changes. This dynamic functionality, combined with various playback and navigation features, equips you with a potent toolset for steering your analysis. It effectively allows you to mimic real-time signal analysis using pre-recorded, offline signals.
Any sequence of values is a “signal”: In SIGVIEW, the concept of a "signal" encompasses any array of X/Y values, be it an audio signal, a spectrum, or any other data representation. This broad definition means that every sequence is attributed a sampling rate, applicable even to data not originating from the digital sampling of an analog signal. For instance, the "sampling rate" of an FFT analysis result is determined by the count of its bins (values) per unit of frequency (Hz) on the X-axis.
This framework enables a flexible approach to analysis, such as conducting an FFT on the results of a previous FFT. While at first glance, such an operation might appear unconventional, it can unveil intriguing insights under certain circumstances. The core philosophy of SIGVIEW is the absence of constraints on analytical exploration. You're encouraged to experiment freely, pioneering your unique methodologies to achieve the insights you seek.
Signal graph/Linked windows: If one window is created as a result of the analysis from any other window, then those two windows are linked. The network of linked windows works like a complex analysis machine where the output of each window is the input for its child windows. It means that all changes in one window will cause its child windows to recalculate and redraw their content. A good example is a part of the signal and it’s FFT; if you slide a part of the signal through the whole signal, its FFT result window will recalculate on each move to show the FFT result of each new signal segment.
Moving through signals: You will usually work and perform analysis on a small part of a longer signal. If your signal is zoomed-in to a smaller part, you can use arrow keys or playback commands to move through the signal and observe changes in analysis results. One of the standard procedures for working with signals would be:
- Load one long signal and zoom-in to some power-of-2 length segment
- Perform some analysis on that segment, for example FFT
- Use "Track changes as 3D graphics" function on that calculated FFT
- Return to the signal window and use left/right arrow keys to move the segment through the whole signal
- That way, you will be able to observe spectral changes in a signal through time and "record" consecutive spectra in a 3D graphic
Data acquisition/monitoring: Working with a data acquisition window in SIGVIEW is akin to using any standard signal window, with one notable distinction: if data acquisition is active, the incoming signal updates at set intervals based on your acquisition settings. This process prompts the signal analysis system to automatically refresh and update all windows associated with the data acquisition. If your computer is sufficiently powerful, you'll have the flexibility to modify or construct your analysis framework in real-time as data is being collected. However, for smoother operation on less capable systems, it's advisable to set up your analysis structure first, then start data acquisition to monitor the outcomes.
Control window: Working with many signals and analysis windows at the same time can become quite confusing. In those situations, you can use the Control Window to display your signal analysis system in a tree-view form where you can easily understand signal flow, perform operations on multiple signals, hide and show windows and choose which signals to show as overlay.
Properties: You can change parameters for most analysis windows even after they are created. If this is supported for a certain window type, Edit/Properties menu options will be enabled in the main menu or in the context menu for that specific window. By using this option, you will be able to change window properties like cut-off frequencies for filtered signal, spectral analysis settings for FFT and Time-FFT, scale limits for instruments, etc.