Tracking Changes of Signal Parameters through Time
We will show you here how to track changes of some signal parameters during data acquisition or monitoring. For similar functionality for file-based analysis, see Instrument values over time.
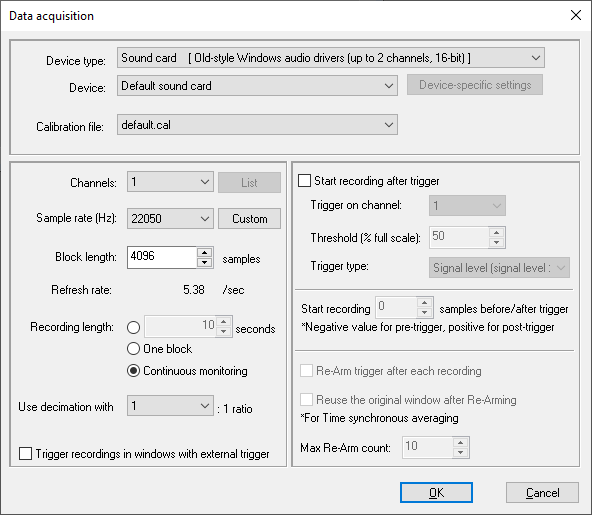
1. Let us take a sound card device as an example. You can connect some signal source to it before you start (microphone). Open the "Data acquisition" dialog ("Data Acquisition/Open data acquisition" menu item), choose "Sound card" or “DirectSound” as device type and your sound card name as "Device". Leave all other default settings. Click OK and the data acquisition signal window will open.
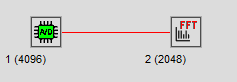
2. While in the data acquisition signal window, press the FFT button in the toolbar to calculate spectrum of a signal. The spectrum window appears and the Control Window should look like this:
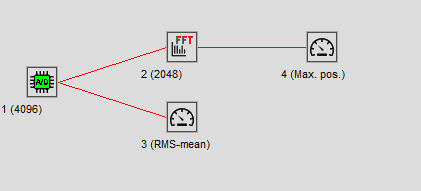
3. As an example, we will track changes in signal RMS energy and the position of the peak spectrum frequency. Click on the signal acquisition window and select the "Instruments and markers/RMS - normalized" main menu option. Then click on the FFT window and select the "Instruments and markers/Maximum position (with marker)" main menu option. Two instrument windows will appear, showing current values from the signal and spectrum (all zeros because data acquisition is not running yet). The resulting Control Window should look like this:
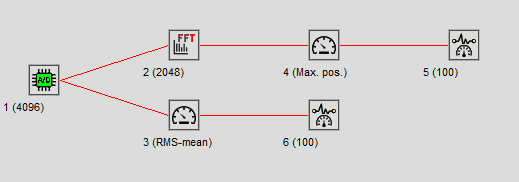
4. Now we would like to track (log) instrument values as they change through time. To do this, click on each of the two instrument windows and select "Log instrument values" from their right-click menu. In the small dialog asking you about buffer length for a log, leave the default value of 100. The Control Window should look like this:
5. Now go to the data acquisition signal window and select the "Data acquisition/Start" menu option (or  button in the toolbar). Recording from the sound card will begin and instruments will change their values. On each instrument value change, the last value will be stored in a corresponding log window; the log window signal will grow as new values come.
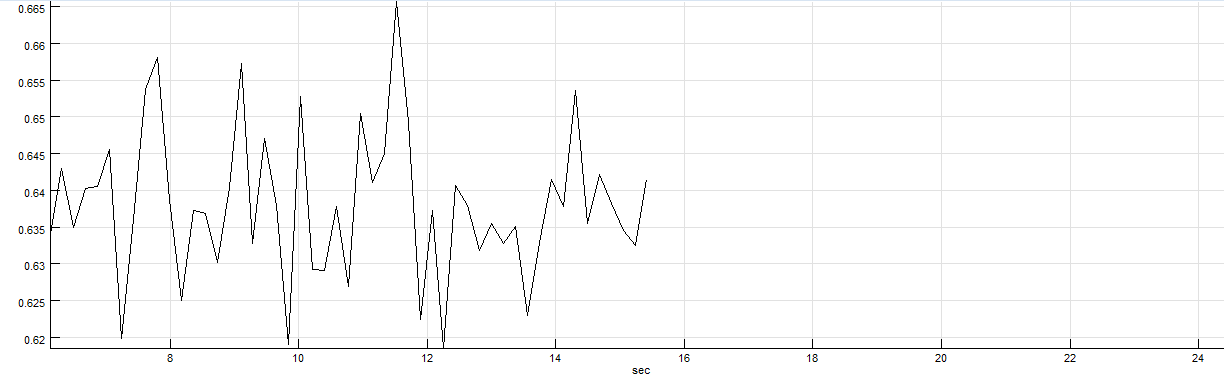
6. After 100 changes (remember your setting for buffer length), log windows will be full, and the display will start scrolling. You can use the context menu to reset data (i.e. start from the beginning) or to stop/start logging. The value log signal will try to automatically determine values for its X-axis by backtracking through the analysis chain. If those X values are equidistant (i.e. the difference between two consecutive values is always the same), those will be displayed on the X-axis. If not, the X-axis will switch to a unit called "change" where each new value will simply be labelled with its index, i.e. 0,1,2,3,4...
7. Instrument log windows can be used as any other signal window, i.e. you can calculate its spectrum, show them in overlay with other signals, store values in ASCII/CSV file etc.